The S&P had one of the spectacular returns in 2019. The index shot by nearly 31% on price only basis. With dividends reinvested, the total return was 33%. This return was the best return in the 30 to 40% range since 1928.
The following chart shows the annual total return of the S&P since 1928:
Click to enlarge
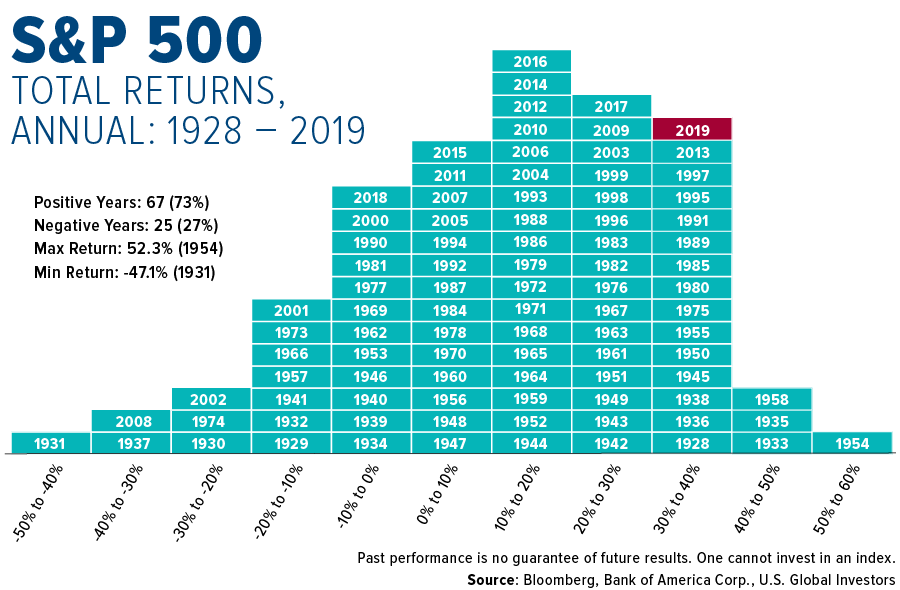
Source: “Buy-and-Hold” Has Historically Been a Winning Investment Strategy by U.S. Global Investors
The S&P has positive returns in nearly three-fourths of the time period.
Related ETFs:
- SPDR S&P 500 ETF Trust (SPY)
Disclosure: No Positions
S&P 500 Index Related Articles:
- The Complete List of Constituents of the S&P 500 Index
- On The Evolution Of The S&P 500 Since Inception
- S&P 500 Calendar Year Returns vs. Intra-Year Returns: Chart
- S&P 500 Annual Total Returns From 1928 To 2019: Chart
- The S&P 500 Dividend Yield is at a 20-Year Low
- The Top 30 Stocks in the S&P 500 over the Past 30 Years
- Contribution of Price Appreciation and Dividends to the S&P 500 Total Return by Decade
- The Average Company Lifespan in the S&P 500 Index is Falling
- Gold vs. S&P 500 Long-Term Returns: Chart
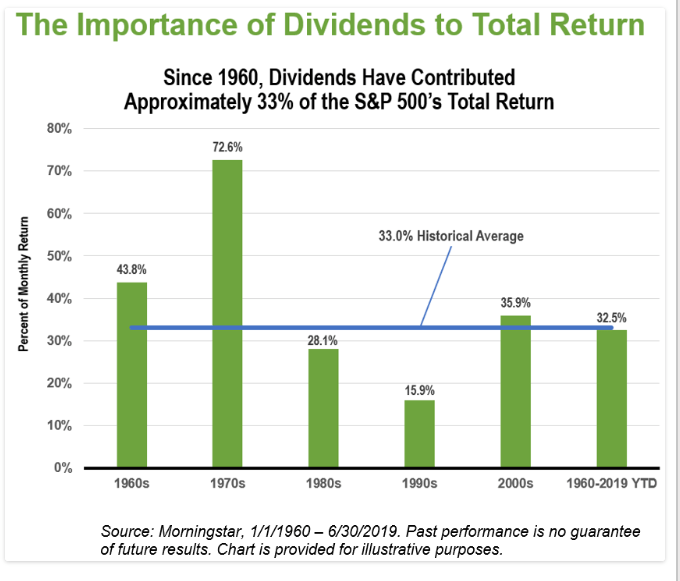
- How Much Dividends Contribute to S&P 500’s Total Return
- Intra-Year Declines of S&P 500 Index Since 1948