The S&P 500 index closed at 3,841.94 yesterday and is up 2.29% year-to-date on price return basis. The 5-year and 10-year annualized returns are 13.95% and 11.27% respectively. This growth rate is indeed excellent when compared to foreign equity markets. The US market as represented by the S&P 500 has performed very well not just in the past few years but also in the long run. Since inception in 1957, the index has grown steadily despite many bear markets and many crises. The below chart shows this great run.
Click to enlarge
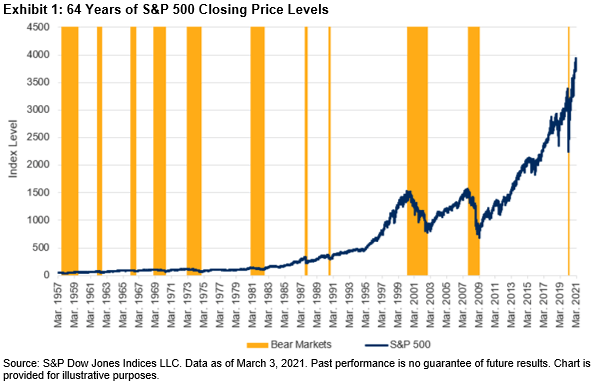
Source: Celebrating 64 Years of the S&P 500 by Hamish Preston, S&P Indexology Blog
An excerpt from the above article:
The S&P 500® was launched on March 4, 1957, and so yesterday marked its 64th birthday. To celebrate this milestone, a number of my colleagues and I recently appeared on our Index Investment Strategy team’s weekly call (sign up for the daily dashboard to receive the invite). If you couldn’t make it, here are a few highlights.
Exhibit 1 shows the S&P 500’s closing price levels over its live history. Eleven bear markets captured periods of pessimism, while the intervening recoveries reflected improved outlooks. Overall, the index posted an annualized price return of around 7.2% over the last 64 years.
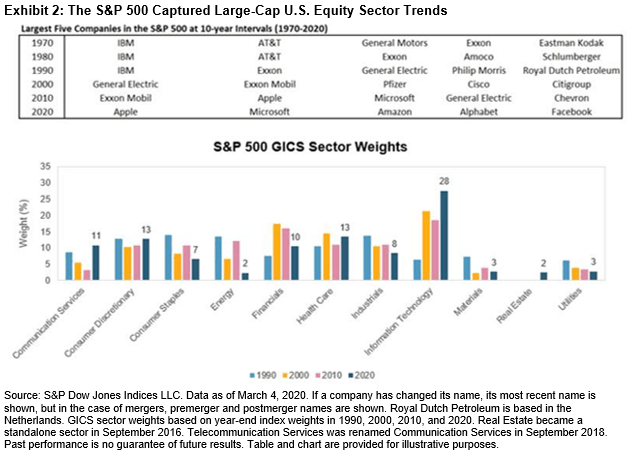
The benchmark index has evolved over the years and has captured the top sector trends as well. The following chart shows the top five companies in the index in each decade since 1970. Many of the the market leaders of the 2000s have crashed and have become so-so run companies now. Lumbering oil giant Exxon Mobil(XOM) got kicked out of the index. General Electric(GE), Cisco(CSCO) and Citigroup(C) are like dead-man walking on life-support for many years now. From the article:
Representing the Large-Cap U.S. Equity Market
The S&P 500 represents the large-cap segment of the U.S. equity market. The index is float-market-cap weighted, which means that index weights reflect aggregate investor expectations. Exhibit 2 shows how the evolution of the largest five companies in the S&P 500 and its GICS® sector weights captured the increased importance of Information Technology companies, and the reduction in Industrials and Energy companies.
The key takeaway is the stocks go up in the long-term and sectors and leaders change over the years as technology and consumer tastes change. So the trick is not to fall in love with one sector or a company forever. An easy option to avoid the pitfalls of failing to keep up with changes is to simply buy a passive fund like an ETF that replicates the performance of the S&P 500.
Related ETF:
- SPDR S&P 500 ETF (SPY)
Disclosure: No Positions


