Callan has published their latest edition of The Callan Periodic Table of Investment Returns with data from 1999 thru 2018. The table was first created by Jay Kloepfer and published in 1999. Since then the table has become widely popular as it is an excellent tool to analyze the importance of diversification among various asset classes.
Updated: The Callan Periodic Table of Investment Returns From 2000 to 2019: Chart
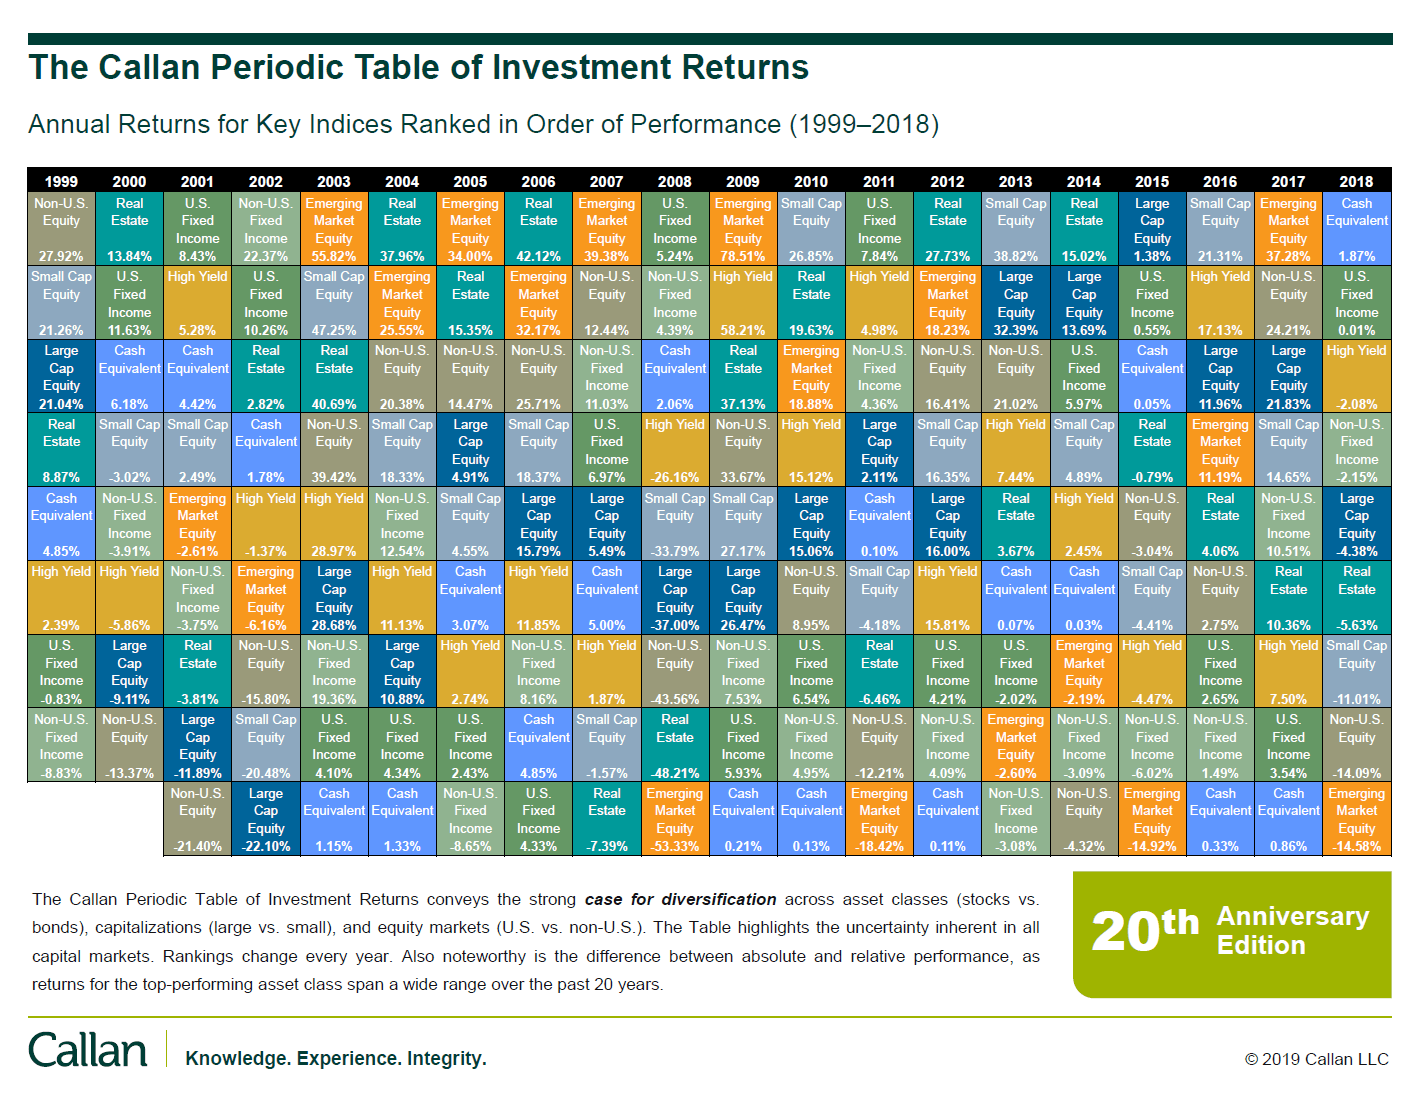
The Callan Periodic Table of Investment Returns From 1999 to 2018:
Click to enlarge
Source: Callan
Download:
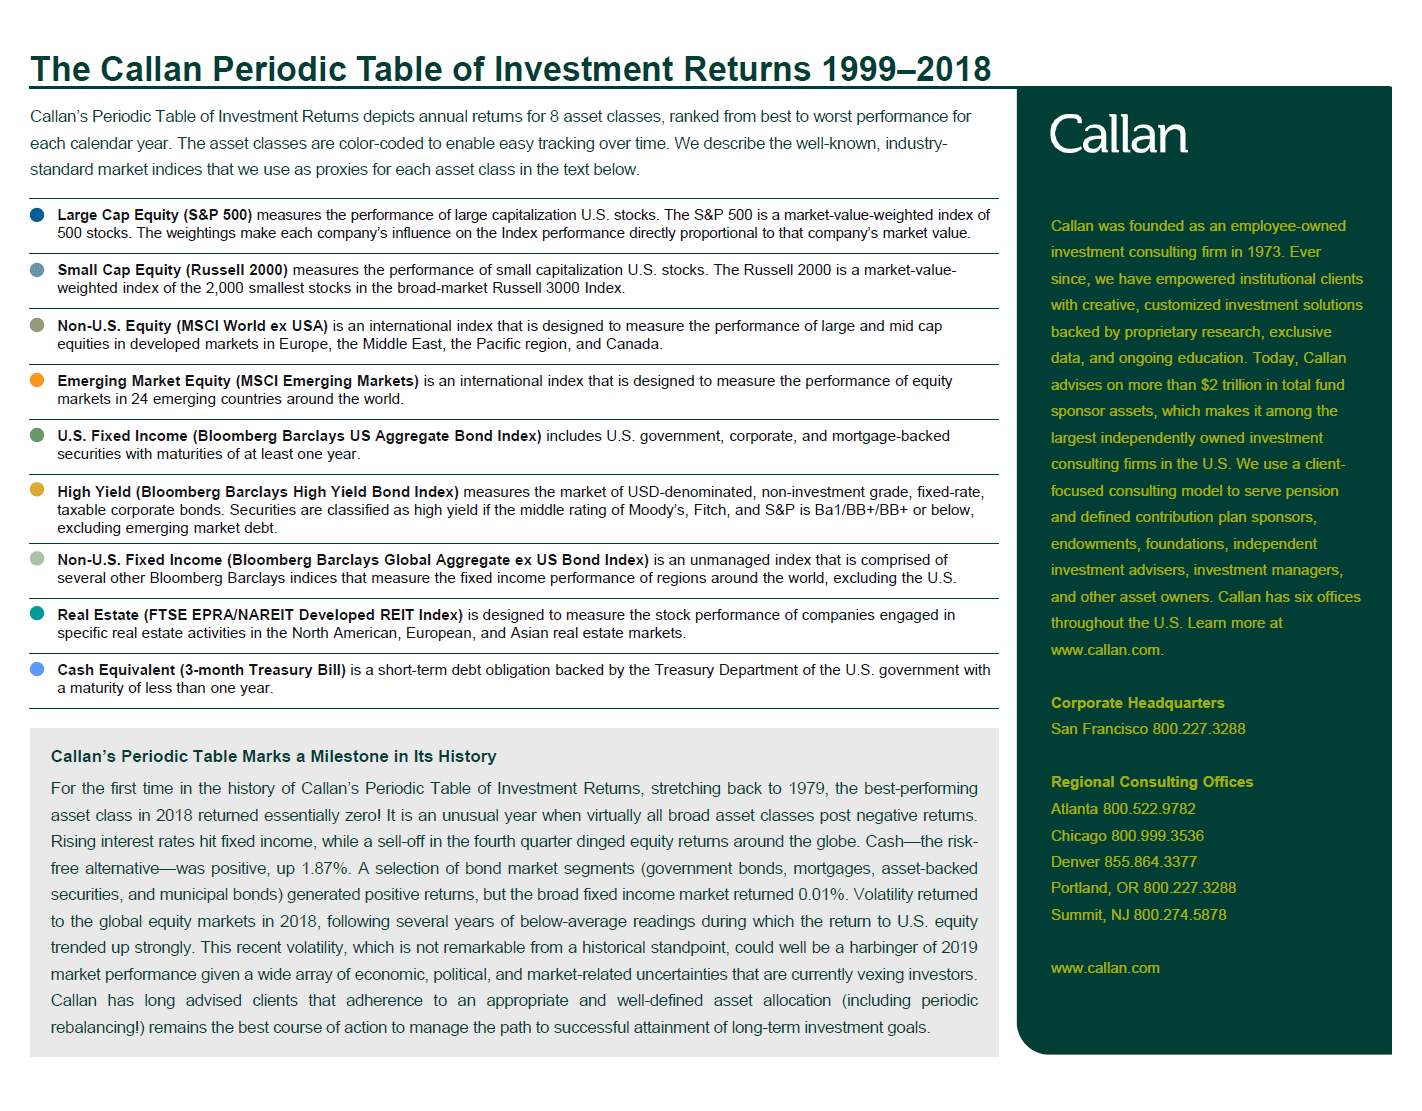
In 2018, cash was king with a return of 1.87%. US stocks were down with large caps off by 4.38%. While US stocks were on solid upward trend for most of the year, from October they started declining dramatically and ended the year in red. The worst performing equities were emerging market equities with a loss of about 15%.
An investor with a diversified portfolio of cash, fixed income, US and foreign stocks, etc. would have performed relatively better than simply holding one asset type.
Earlier:


