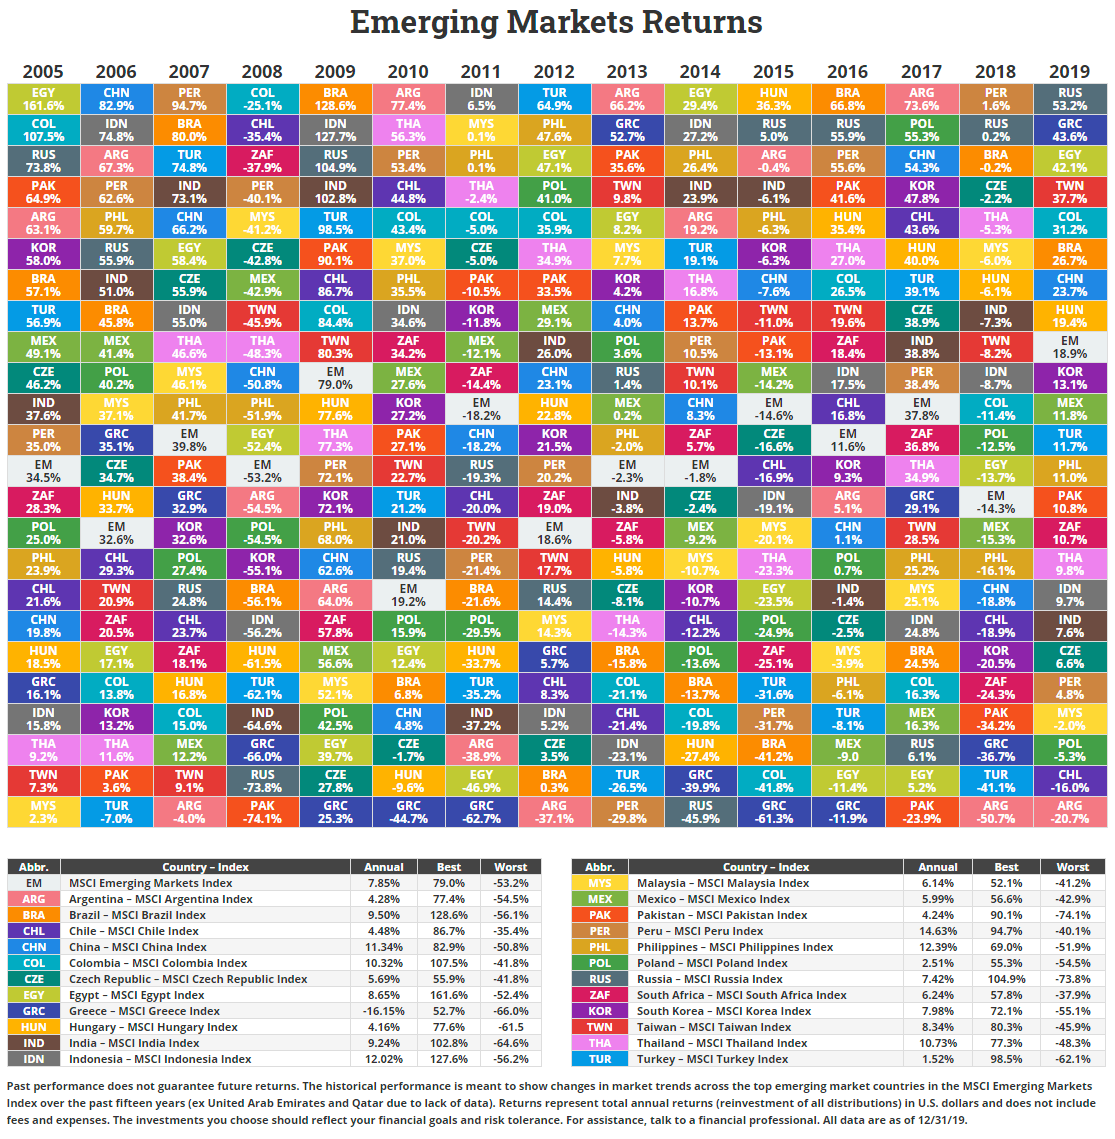
Emerging market equity returns vary wildly from one country to another. In addition, similar to developed markets, no country is the top performer in consecutive years. One year’s best performer can turn into next year’s worst performer. Novel Investor recently updated his returns chart for emerging markets. The following chart shows the equity returns of single country MSCI indices for emerging markets from 2005 thru 2019:
Click to enlarge
Credit: Novel Investor
Russia was the best performing market in 2019. In 2008, during the global financial crisis it was most negative return at nearly 74%. Last year the situation was reversed with Russia gaining over 53%. While Greece went into tailspin a few years ago in 2019 it was the second highest returning emerging market.
The colorful above chart also shows the importance of diversification. Within emerging markets, it is always wiser to distribute one’s assets across countries to reduce risk and increase potential gains.
Related ETFs:
- Market Vectors Russia ETF (RSX)
- iShares MSCI Mexico Capped Investable Market (EWW)
- iShares FTSE/Xinhua China 25 Index (FXI)
- The iShares MSCI India ETF (INDA)
- iShares MSCI Brazil Index (EWZ)
- iShares MSCI All Peru Capped Index (EPU)
- Global X FTSE Colombia 20 ETF (GXG)
Disclosure: No Positions


