Callan has updated their popular “The Periodic Table of Investment Returns” with 2019 data. This chart shows the importance for diversification. For instance, U.S. large caps were the top performers in 2019 with a return of over 31%. Emerging markets which used to be hot a few years ago did not have such a great year. Emerging market equities earned just over 18% relative to the spectacular performance of American stocks. It should be noted however Russia was one of the top markets last year. However overall as a group emerging markets simply well underperformed US markets.
Other developed markets also earned lower returns than the US with the Developed excluding the US growing over 22%.
The Callan Periodic Table of Investment Returns From 2000 to 2019:
Click to enlarge
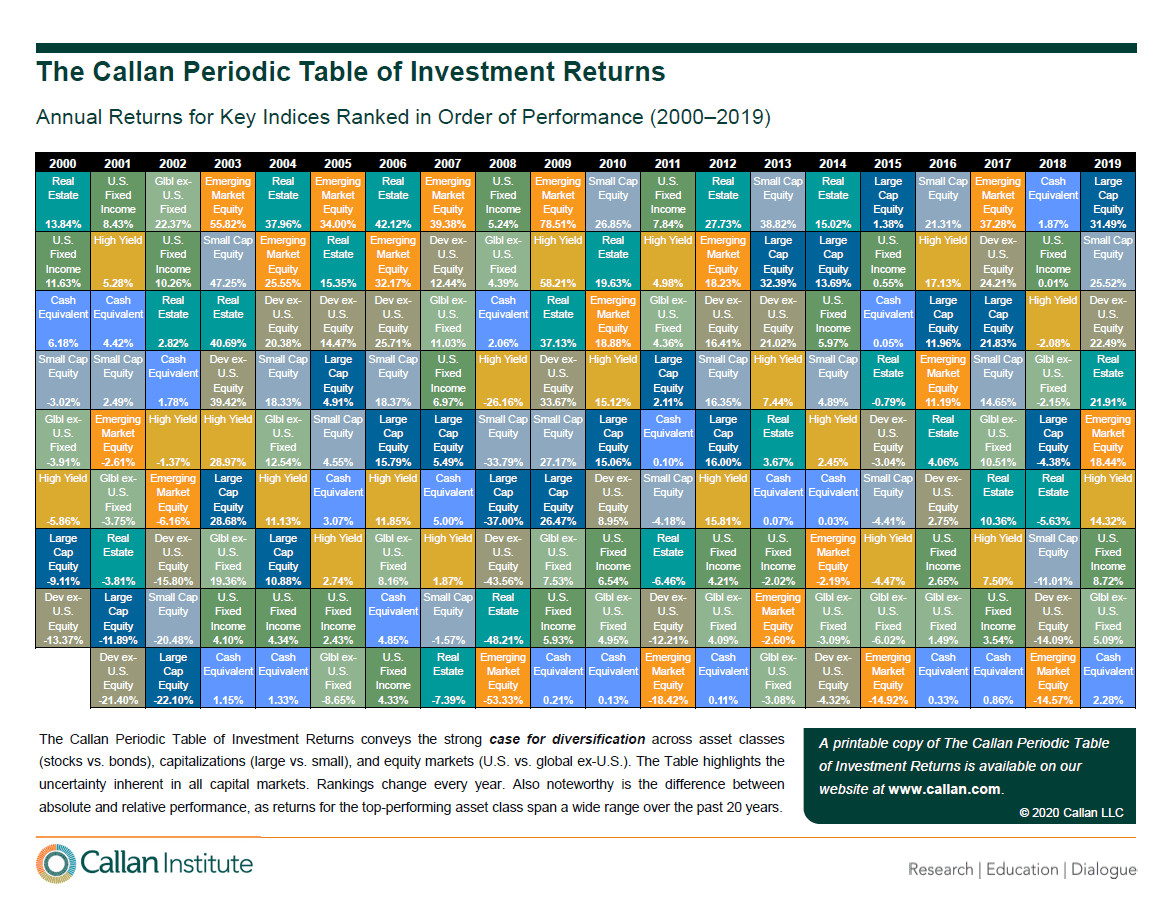
Source: Callan LLC
Download:
Key Takeaway:
The importance and benefits of diversification cannot be understated. As the chart above shows, an investor overweight in emerging equities would have missed the substantial growth of US equities. Since it is impossible to predict which market and sector will outperform in any given year, the wise move is to allocate one’s assets across a wide range of sectors, countries and asset classes.
Past Callan Charts:
- The Callan Periodic Table of Investment Returns From 1999 to 2018: Chart
- The Callan Periodic Table of Global Equity Investment Returns 1999–2018
- The Callan Periodic Table of U.S. Equity Investment Returns 1999-2018
- The Callan Periodic Table of Real Estate Investment Returns 1999–2018
- The Callan Periodic Table of Investment Returns From 1998 to 2017: Chart
- The Callan Periodic Table of Investment Returns 2016: A Review
Related ETFs:
- iShares Dow Jones Select Dividend ETF (DVY)
- SPDR S&P Dividend ETF (SDY)
- Vanguard Dividend Appreciation ETF (VIG)
- SPDR S&P 400 Mid Cap Growth ETF (MDYG)
- iShares Russell Midcap Index Fund (IWR)
- iShares MSCI Emerging Markets Indx (EEM)
- SPDR S&P 500 ETF (SPY)
- Vanguard MSCI Emerging Markets ETF (VWO)
- SPDR S&P 500 ETF (SPY)
- SPDR KBW Bank ETF (KBE)
- SPDR KBW Regional Banking ETF (KRE)
- SPDR S&P 500 ETF (SPY)
- Vanguard Dividend Appreciation ETF (VIG)
- SPDR S&P Dividend ETF (SDY)
- SPDR STOXX Europe 50 ETF (FEU)
Disclosure: No Positions


