The following is the Periodic Table of U.S. Equity Investment Returns from 1999 thru 2018. It shows the annual returns of various US equity indices such as the S&P 500, Russell 1000, Russell 3000, etc. in the order of performance:
Click to enlarge
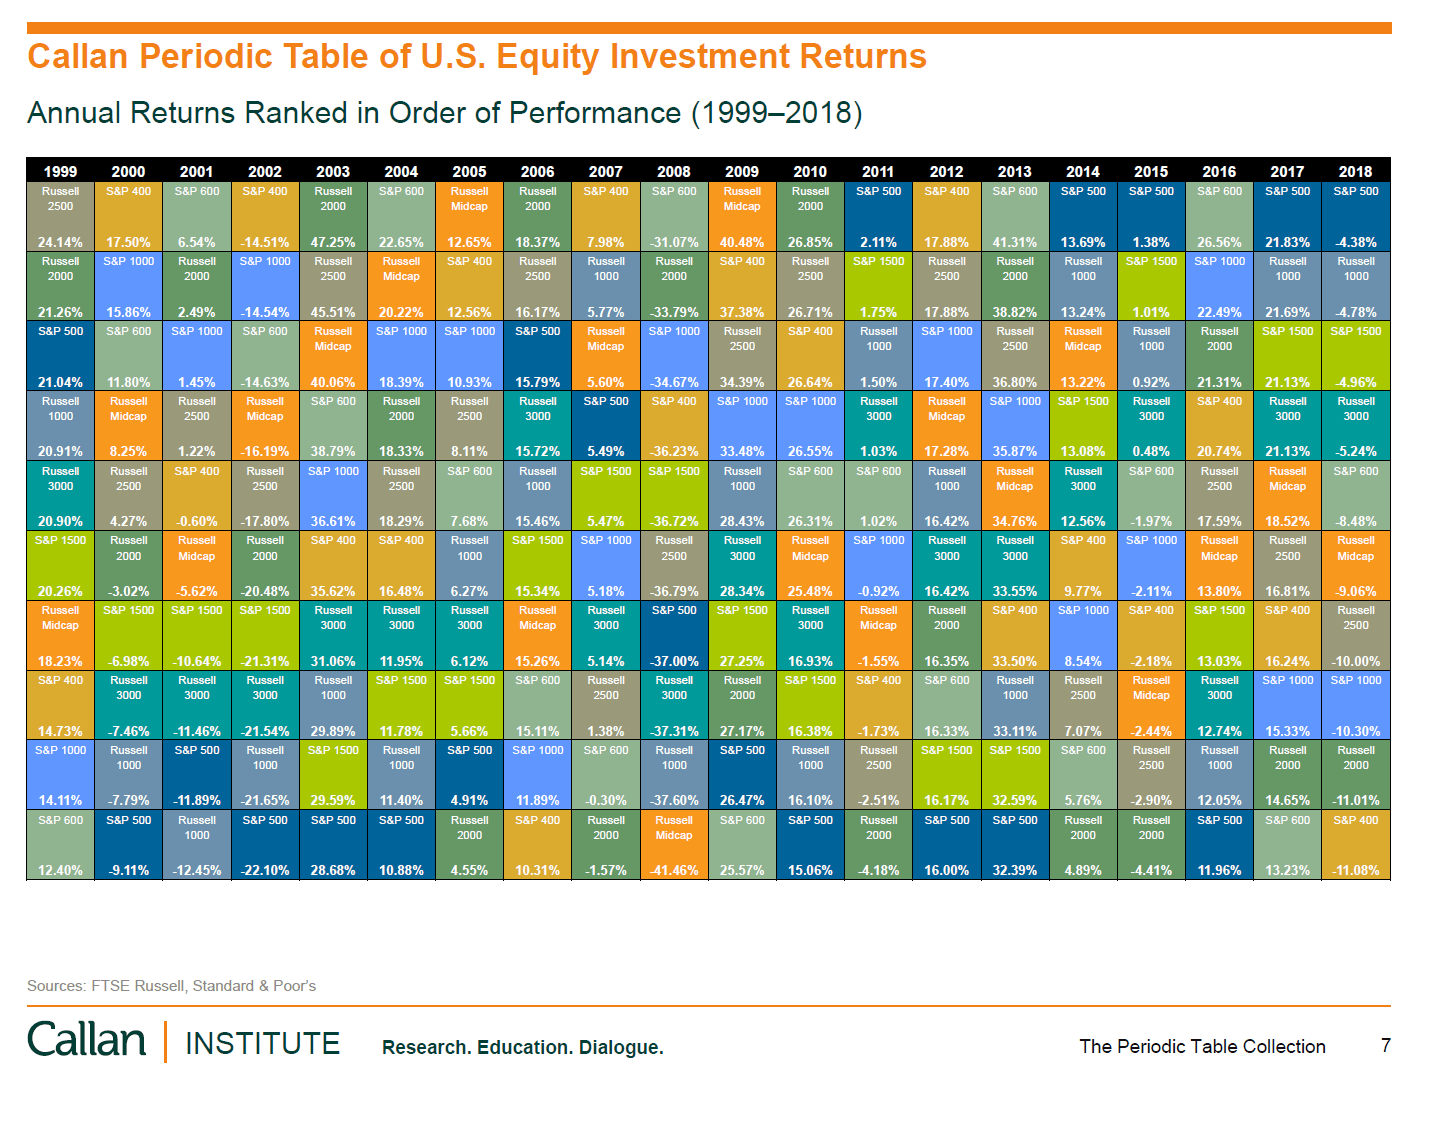
Source: The Periodic Table Collection – 20th Anniversary Edition, Callan Institute
In the past five years, the S&P 500 has been the best performing index in 4 years. So far this year, the index is up by double digit percentage points. It remains to be seen if the solid gains will hold thru the end of the year.
Download:
- The Periodic Table Collection – 20th Anniversary Edition (complete list of charts in pdf)
Related ETFs:
Disclosure: No Positions


