The World’s Busiest Airports by Passenger Traffic in 2018: Chart

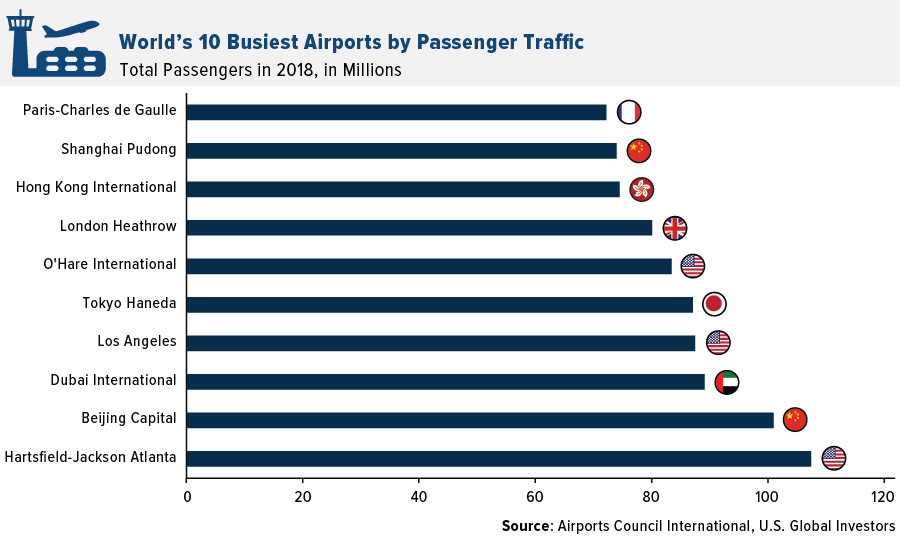
I came across the following chart on the world’s busiest airports in 2018. Three US airports are in this list with Atlanta taking the top spot.The other two airports are Los Angeles and Chicago’s O’Hare.

Click to enlarge

Source: Explore the World’s 10 Busiest Airports, U.S. Global Investors

Though Atlanta consistently ranks as the world’s busiest airport, most the traffic is domestic and not international. London’s Heathrow is the world’s busiest airport based on international passenger traffic.

You can find many other fascinating facts in the above linked article.

S&P 500 Sector Total Returns 2007 To 2019: Chart

The following chart shows the sector returns for the S&P 500 from 2007 to 2019. This is the last chart in the series published by Novel Investor. Earlier I posted return charts for International Developed Markets and Emerging Markets.

Note: Click S&P 500 Sector Performance by Year From 2007 To 2021 for the latest chart.

Click to enlarge


Note: Returns shown above are Total Returns (i.e. returns including dividends reinvested)

Source: Novel Investor

In 2019, the best performer was the IT sector with an astonishing growth of over 50%. The energy sector had the worst return even as oil prices stabilized and increased.

Diversification is the simplest and easiest way to reduce risk and increase a portfolio’s return. The above colorful chart vividly illustrates the point.

In addition, the chart also shows that not one sector is the consistent winner year after year.

Related ETFs:

  • SPDR S&P 500 ETF (SPY)
  • S&P MidCap 400 SPDR ETF (MDY)
  • SPDR Consumer Discretionary Select Sector SPDR Fund (XLY)
  • SPDR Consumer Staples Select Sector SPDR Fund (XLP)
  • SPDR Energy Select Sector SPDR Fund (XLE)
  • SPDR Financials Select Sector SPDR Fund (XLF)

Disclosure: No Positions


International Developed Stock Market Returns 2005 to 2019: Chart

I posted the returns chart for emerging markets in an earlier article. The following chart shows the equity returns of single country MSCI indices for developed markets from 2005 thru 2019:

Click to enlarge

Credit: Novel Investor

Among the developed markets, New Zealand was the best performer with a return of about 39% in 2019 followed by Ireland. The market with the worst return was Israel and the second poor performer was Hong Kong. Even the Brexit bogged down UK yielded a decent 21% return.

Related ETFs:

  • iShares MSCI Germany Index Fund (EWG)
  • iShares MSCI Canada Index Fund (EWC)
  • iShares MSCI Australia Index Fund (EWA)
  • iShares MSCI United Kingdom Index (EWU)
  • iShares MSCI Singapore Index (EWS)

Disclosure: No Positions

The Top 10 Electric Car Manufacturers in the World

Electric cars are increasingly becoming popular among consumers especially among the environmentally conscious. Though Europe leads in adoption of electric autos consumers in the US are also slowly changing their vehicle preferences. China is the world’s top market for electric autos and other green vehicles including buses.

US-based auto industry disruptor Tesla(TSLA) is leading the electric vehicle revolution not only in the US but also around the world. With that said, recently I read an interesting piece on the impact of Tesla and Chinese electric auto makers on the German auto industry. The article listed the top auto makers in this evolving industry.

The Top 10 Electric Car Manufacturers in the World are shown in the chart below:

Click to enlarge

Source: The End of an EraWill Tesla and Google Kill the German Car? , Der Spiegel

After Tesla, China’s 3 auto makers – BYD, BAIC and SAIC leads the ranking. Among US giants, Ford(F) is missing in this list.

An excerpt from the above article:

Late To The Game

But it was only very recently that the German automobile industry finally came to the realization that it is going to need to radically adapt. The industry, led by Volkswagen, believed it could solve its problem in two ways: first by creating better, less-polluting and more efficient (diesel) cars and secondly, when the first approach failed, by cheating or denying reality.

As paradoxical as it may sound, VW’s diesel scandal ultimately triggered the modernization push the entire industry needed. Confidence in the industry had been shaken so badly that management and supervisory boards at German car companies were forced to recognize the inevitability of radical change.

But they didn’t reach that realization until very late. Now, companies that were industry leaders in the last century face the real risk of straggling behind in the new era, a development that would have serious consequences for the German economy and the country’s future prosperity. It would be the beginning of a new and uncomfortable era. Because as German companies were busy manipulating their diesel engines and placing their bets on ever bigger SUVs, as they half-heartedly studied and tested alternative drive systems, and as they collected arguments against self-driving cars instead of testing them, a whole new paradigm was unfolding elsewhere in the world. In California and China, private and state-owned companies emerged that are now surpassing Germany’s former technological leaders. They have entirely different views of the car and how it is used.

The entire article is a fascinating read.

Disclosure: No Positions

Also checkout: 

Related Articles:

S&P 500 Annual Total Returns From 1928 To 2019: Chart

The S&P had one of the spectacular returns in 2019. The index shot by nearly 31% on price only basis. With dividends reinvested, the total return was 33%.  This return was the best return in the 30 to 40% range since 1928.

The following chart shows the annual total return of the S&P since 1928:

Click to enlarge

Source: “Buy-and-Hold” Has Historically Been a Winning Investment Strategy by U.S. Global Investors

The S&P has positive returns in nearly three-fourths of the time period.

Related ETFs:

  •  SPDR S&P 500 ETF Trust (SPY)

Disclosure: No Positions

S&P 500 Index Related Articles:

  1. The Complete List of Constituents of the S&P 500 Index
  2. On The Evolution Of The S&P 500 Since Inception
  3. S&P 500 Calendar Year Returns vs. Intra-Year Returns: Chart
  4. S&P 500 Annual Total Returns From 1928 To 2019: Chart
  5. The S&P 500 Dividend Yield is at a 20-Year Low
  6. The Top 30 Stocks in the S&P 500 over the Past 30 Years
  7. Contribution of Price Appreciation and Dividends to the S&P 500 Total Return by Decade
  8. The Average Company Lifespan in the S&P 500 Index is Falling
  9. Gold vs. S&P 500 Long-Term Returns: Chart
  10. How Much Dividends Contribute to S&P 500’s Total Return
  11. Intra-Year Declines of S&P 500 Index Since 1948