The S&P 500 total returns by sector for the years from 2007 to 2021 is shown in the chart below created by Novel Investor. As with other similar charts, this chart shows the need for diversification among the various sectors. The best sector in one year does not necessarily mean it will be best the following year. For instance, the energy sector was left for dead in 2020 and ended up being the worst performer. But last year it roared back as oil prices soared and economies opened again. It is astonishing that real estate ended up as the second best sector with a return of over 46%. Residential real estate soared to beyond bubble levels as people fled cities and investors and speculators entered the market. In 2020, corona indirectly kept this bubble from forming and the sector was a loser.
Click to enlarge
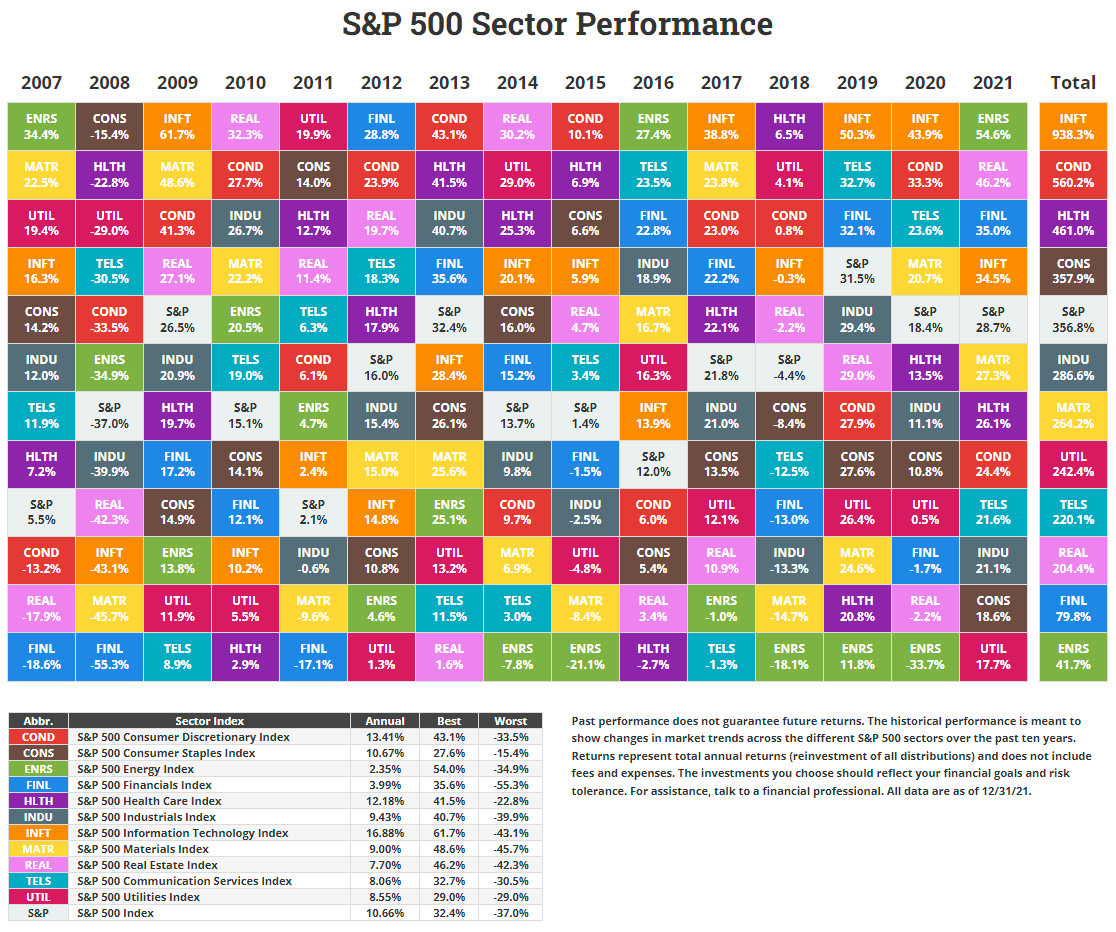
Source: Novel Investor
Related ETFs:
- SPDR S&P 500 ETF (SPY)
- iShares Core S&P 500 ETF (IVV)
- Vanguard S&P 500 ETF (VOO)
- SPDR Portfolio S&P 500 ETF (SPLG)
The Complete List of Constituents of the S&P 500 Index can be found here.
Disclosure: No positions


