The World’s Top 20 Arms Producing and Military Service Companies: Infographics

The World’s Top 20 Arms Producing and Military Service Companies are shown in the infographics below. As usual, US firms dominate the list taking 9 out of the 20 spots and 4 out of the top 5. The world’s largest weapons maker is Lockheed Martin(LMT). Though most people know Boeing (BA) as the maker of airliners, the firm is also leads the world in arms manufacturing. A new report shows that China is now the world’s second largest arms producer ahead of Russia. Traditionally Russia ranked the second, behind only the US.

Click to enlarge
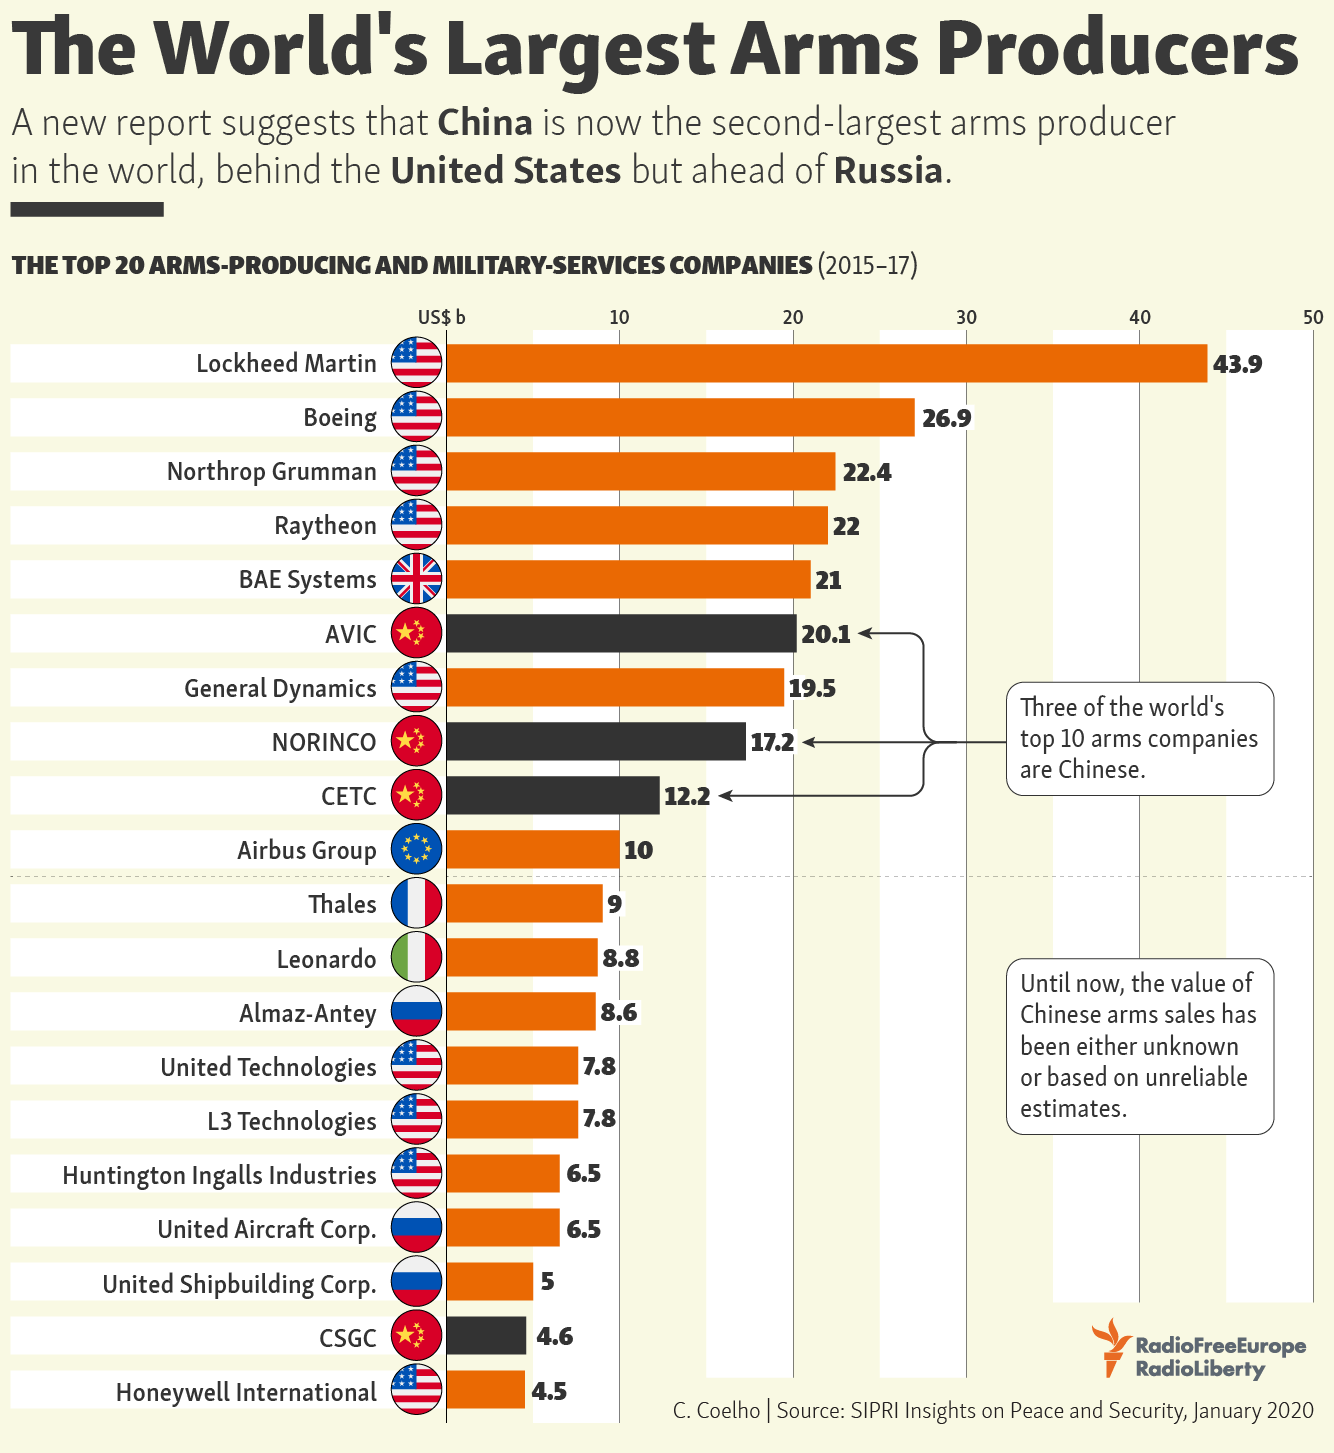
Source: The World’s Largest Arms Producers, RFE/RL

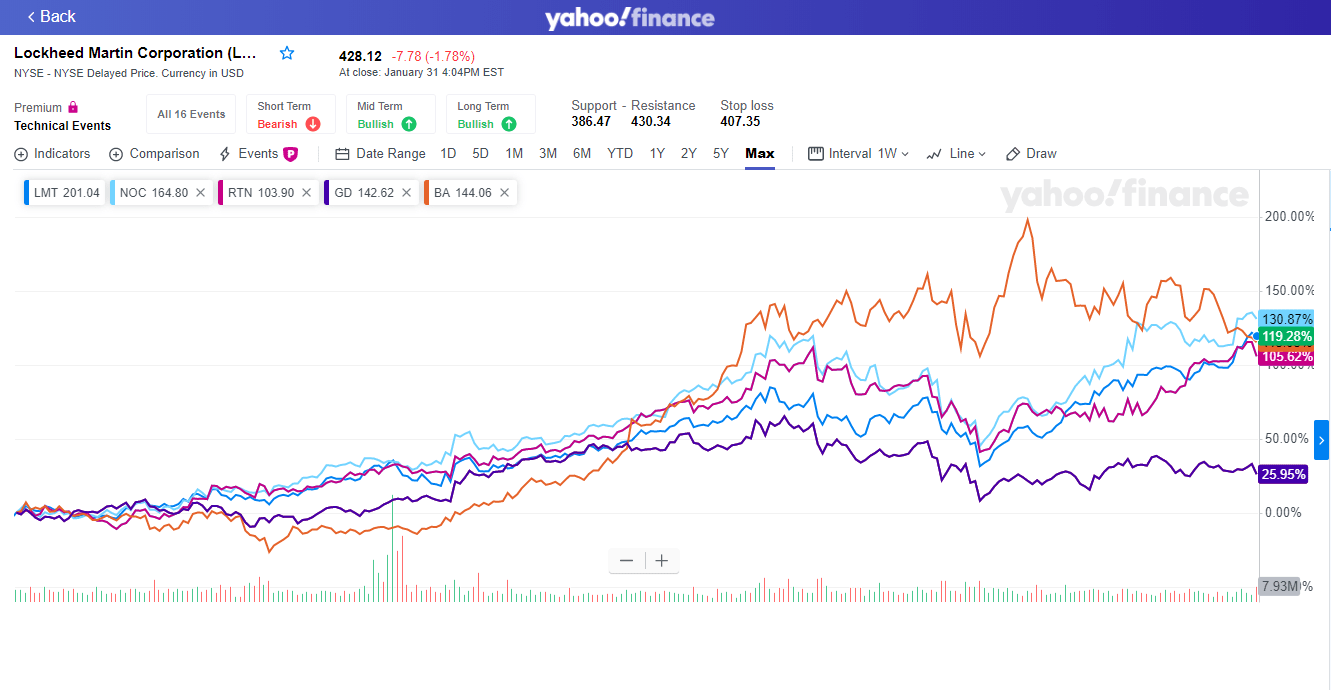
The 5-year returns of the top 5 US defense stocks are shown in the following chart:
Source: Yahoo Finance

Most of them have doubled in price with only General Dynamics(GD) logging a growth of 28%.

Disclosure: No Positions
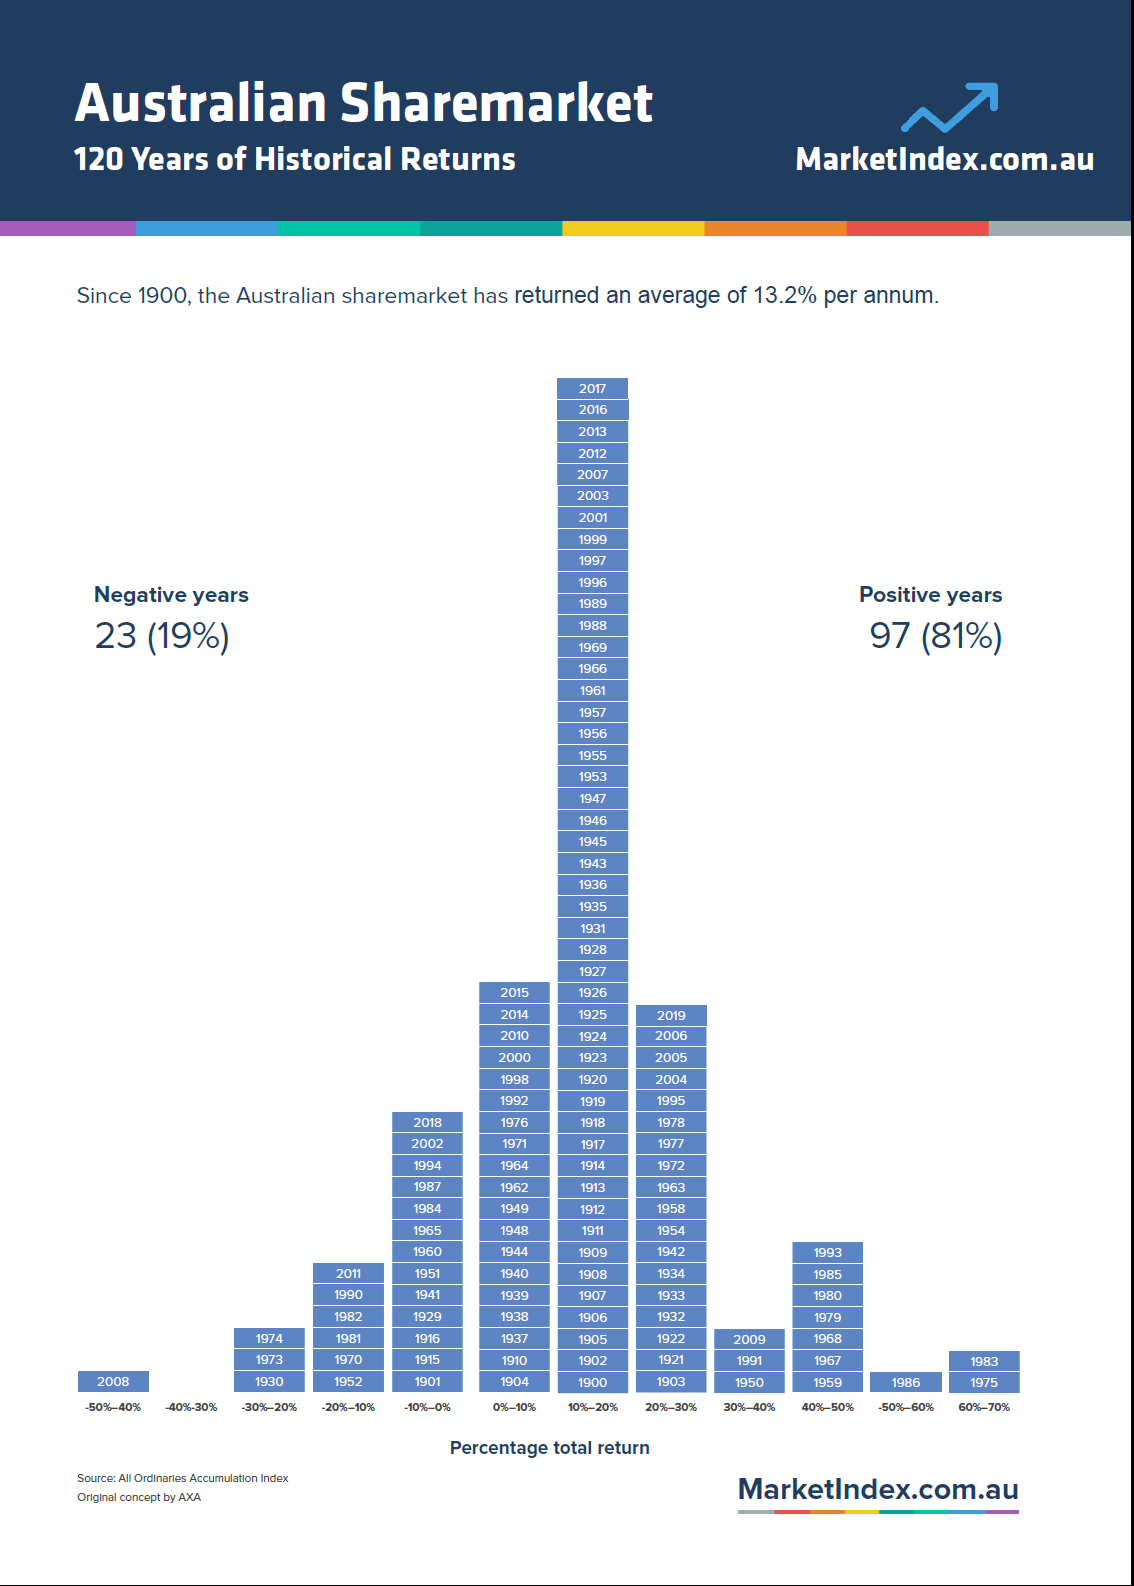
The Historical Average Annual Returns of Australian Stock Market From 1900 To 2019

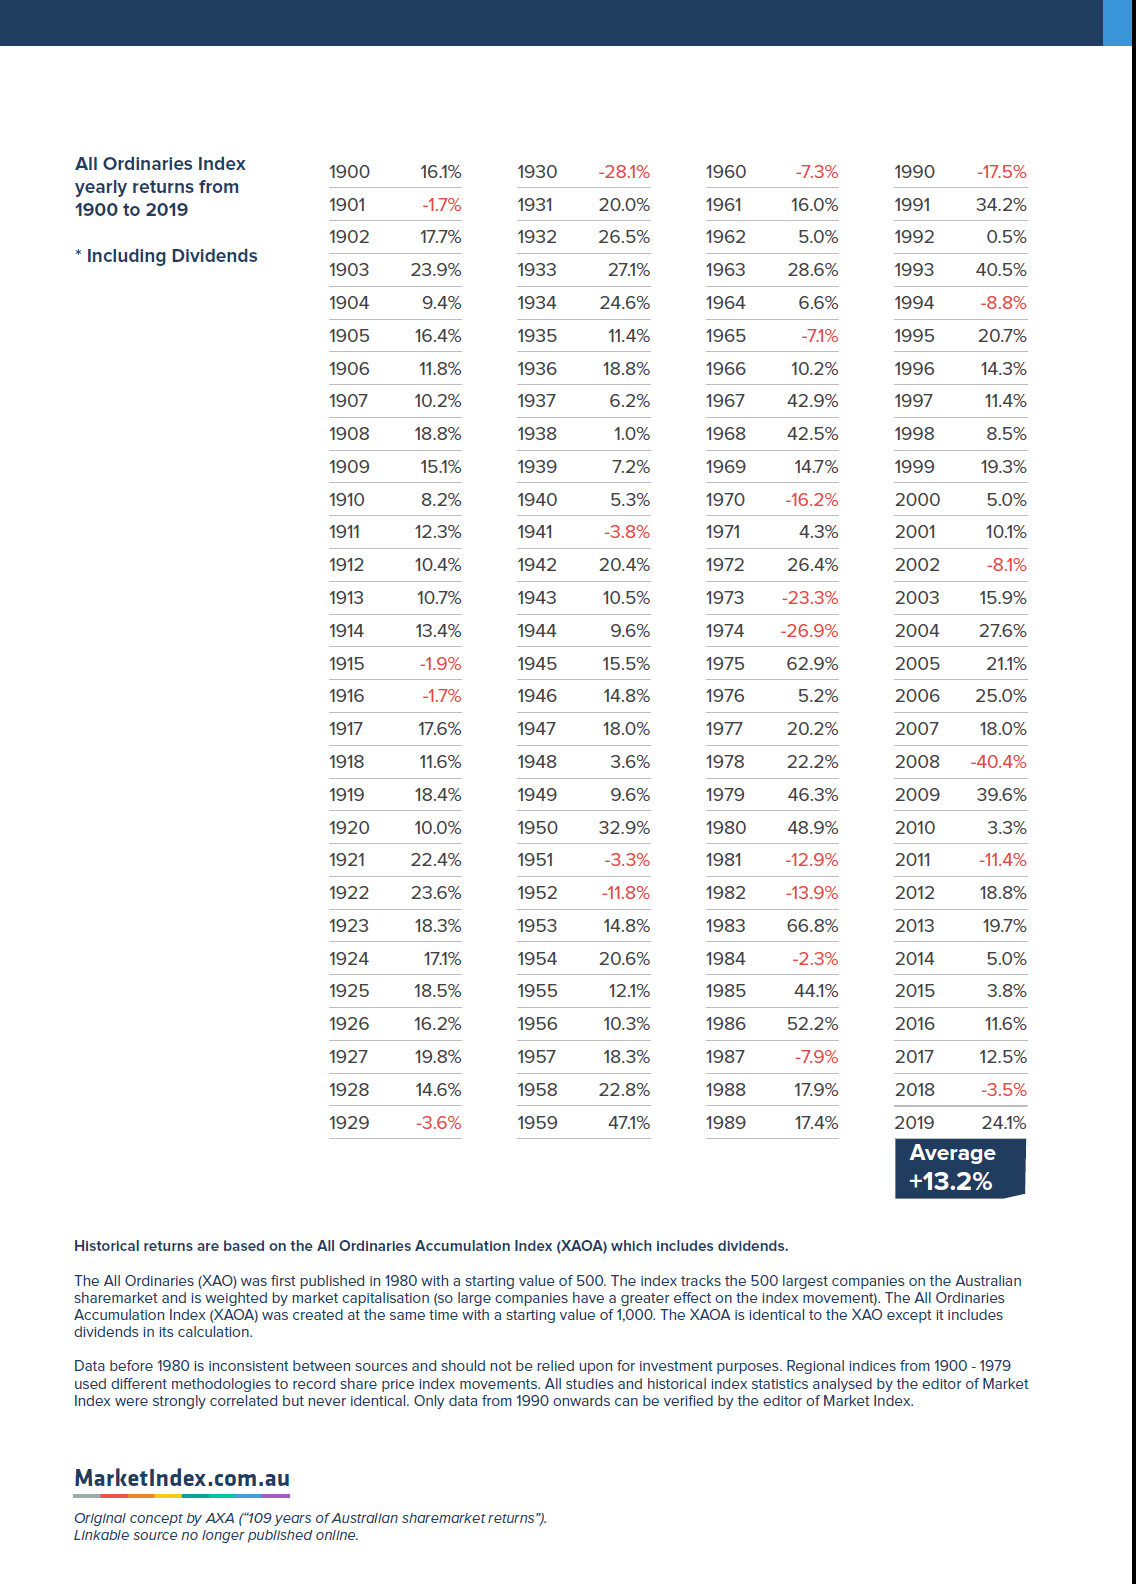
The popular “120 Years of Historical Returns for Australian Sharemarket” has been updated MarketIndex site with data for year 2019. The overall average annual total return just slightly increased to 13.2% per year since 1900.

Update (5/30/21):

The Total Return for the All Ordinaries Accumulation Index in 2020 was 3.64%. The Price Only Return was just 0.71%.

Source: S&P Global

Note: The below chart will be updated with 2020 data when MarketIndex publishes the updated chart.

The following graphic shows the historical annual returns of Australian stocks from 1990 thru 2019:

Click to enlarge

Source: Market Index

Notes:

  • The returns shown above are total returns (i.e. share price returns + dividends).
  • The returns shown are in the local currency.
  • The returns are for the All Ordinaries Index.

Related ETF:

  • iShares MSCI Australia ETF (EWA)

Download:

See Also:

Disclosure: No Positions

The World’s Busiest Airports by Passenger Traffic in 2018: Chart

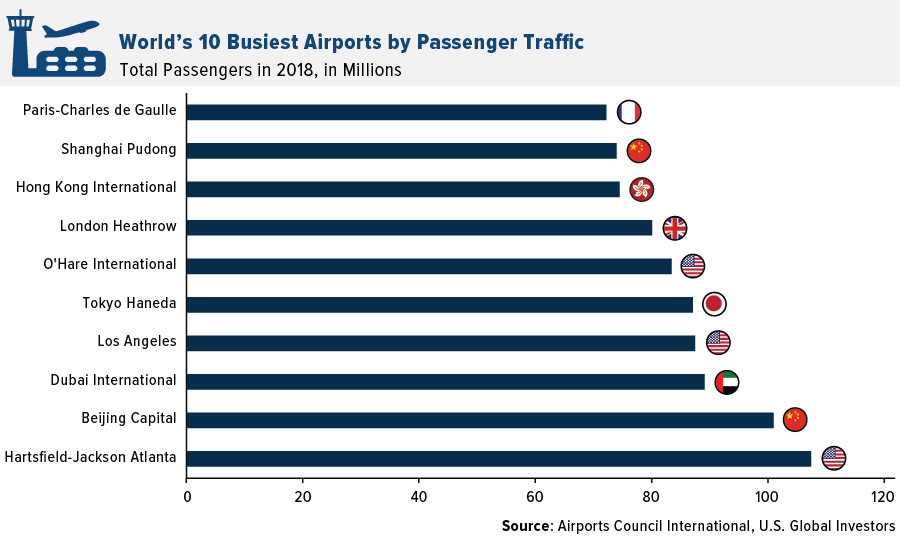
I came across the following chart on the world’s busiest airports in 2018. Three US airports are in this list with Atlanta taking the top spot.The other two airports are Los Angeles and Chicago’s O’Hare.

Click to enlarge

Source: Explore the World’s 10 Busiest Airports, U.S. Global Investors

Though Atlanta consistently ranks as the world’s busiest airport, most the traffic is domestic and not international. London’s Heathrow is the world’s busiest airport based on international passenger traffic.

You can find many other fascinating facts in the above linked article.

S&P 500 Sector Total Returns 2007 To 2019: Chart

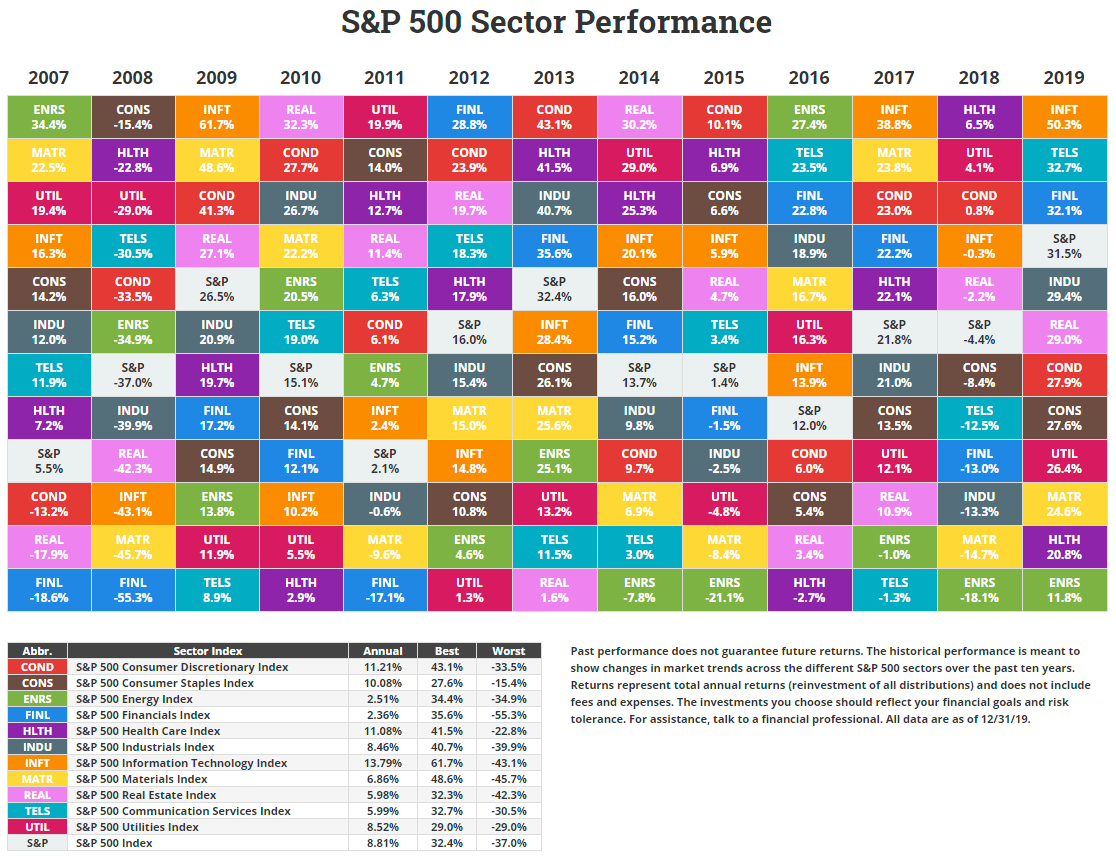
The following chart shows the sector returns for the S&P 500 from 2007 to 2019. This is the last chart in the series published by Novel Investor. Earlier I posted return charts for International Developed Markets and Emerging Markets.

Note: Click S&P 500 Sector Performance by Year From 2007 To 2021 for the latest chart.

Click to enlarge


Note: Returns shown above are Total Returns (i.e. returns including dividends reinvested)

Source: Novel Investor

In 2019, the best performer was the IT sector with an astonishing growth of over 50%. The energy sector had the worst return even as oil prices stabilized and increased.

Diversification is the simplest and easiest way to reduce risk and increase a portfolio’s return. The above colorful chart vividly illustrates the point.

In addition, the chart also shows that not one sector is the consistent winner year after year.

Related ETFs:

  • SPDR S&P 500 ETF (SPY)
  • S&P MidCap 400 SPDR ETF (MDY)
  • SPDR Consumer Discretionary Select Sector SPDR Fund (XLY)
  • SPDR Consumer Staples Select Sector SPDR Fund (XLP)
  • SPDR Energy Select Sector SPDR Fund (XLE)
  • SPDR Financials Select Sector SPDR Fund (XLF)

Disclosure: No Positions


International Developed Stock Market Returns 2005 to 2019: Chart

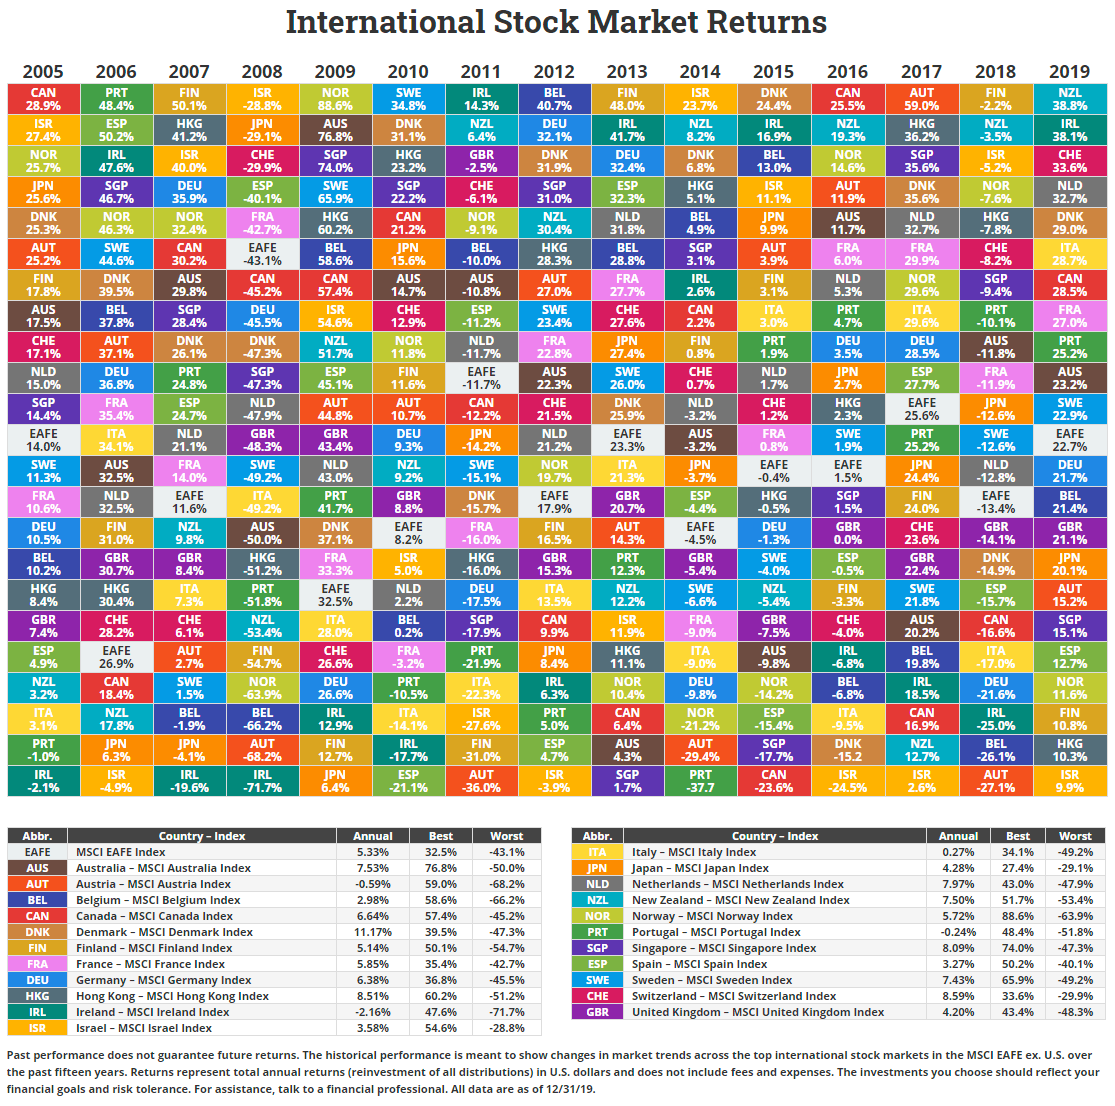
I posted the returns chart for emerging markets in an earlier article. The following chart shows the equity returns of single country MSCI indices for developed markets from 2005 thru 2019:

Click to enlarge

Credit: Novel Investor

Among the developed markets, New Zealand was the best performer with a return of about 39% in 2019 followed by Ireland. The market with the worst return was Israel and the second poor performer was Hong Kong. Even the Brexit bogged down UK yielded a decent 21% return.

Related ETFs:

  • iShares MSCI Germany Index Fund (EWG)
  • iShares MSCI Canada Index Fund (EWC)
  • iShares MSCI Australia Index Fund (EWA)
  • iShares MSCI United Kingdom Index (EWU)
  • iShares MSCI Singapore Index (EWS)

Disclosure: No Positions