Commodity Table of Investment Returns 2008 to 2017

Commodity investing is not for everyone. Investors need not hold commodities as an asset class in their porfolios despite what Wall Street promotes them to be.

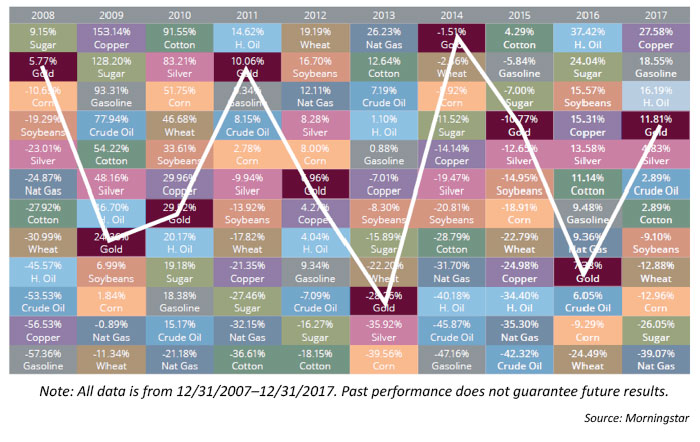
The following chart shows the investment returns for various commodities from 2008 to 2017:

Click to enlarge

Source: Using commodities as a tactical portfolio diversifier, Proactive Advisor Magazine

Commodities are extremely volatile. For example, crude oil fell about 46% in 2014 and then another 42% in the following year. In the next two years, it returns were average.

US Equity Market Corrections and Bear Markets Since 1974

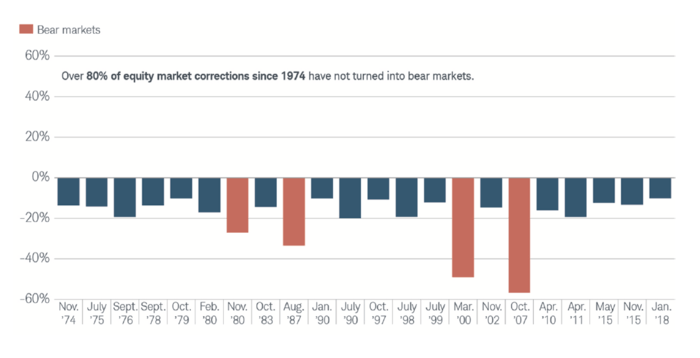
The US equity market may end the year with a loss barring any Santa Claus rally or a miracle. So investors may be wondering if this is the start of a bear market. Bear market is usually defined as a decline of 20% or more. According to an article at Schwab, very few of corrections in the market have turned into bear markets. In fact, since 1974 only 4 have turned into bear markets.

From the article:

Is it the start of a bear market?

Nobody can predict with any degree of certainty whether a correction will reverse or turn into a bear market. However, historically most corrections haven’t become bear markets (that is, periods when the market falls by 20% or more). There have been 22 market corrections since November 1974, and only four of them became bear markets (which began in 1980, 1987, 2000 and 2007).

Since 1974, only four market corrections have become bear markets

Source: Schwab Center for Financial Research with data provided by Morningstar, Inc. Each period listed represents the beginning month/year of either a market correction or a bear market. The general definition of a market correction is a market decline that is more than 10%, but less than 20%. A bear market is usually defined as a decline of 20% or greater. The market is represented by the S&P 500 index. Past performance is no guarantee of future results.

Source: Market Correction: What Does It Mean?, Schwab

Updates:

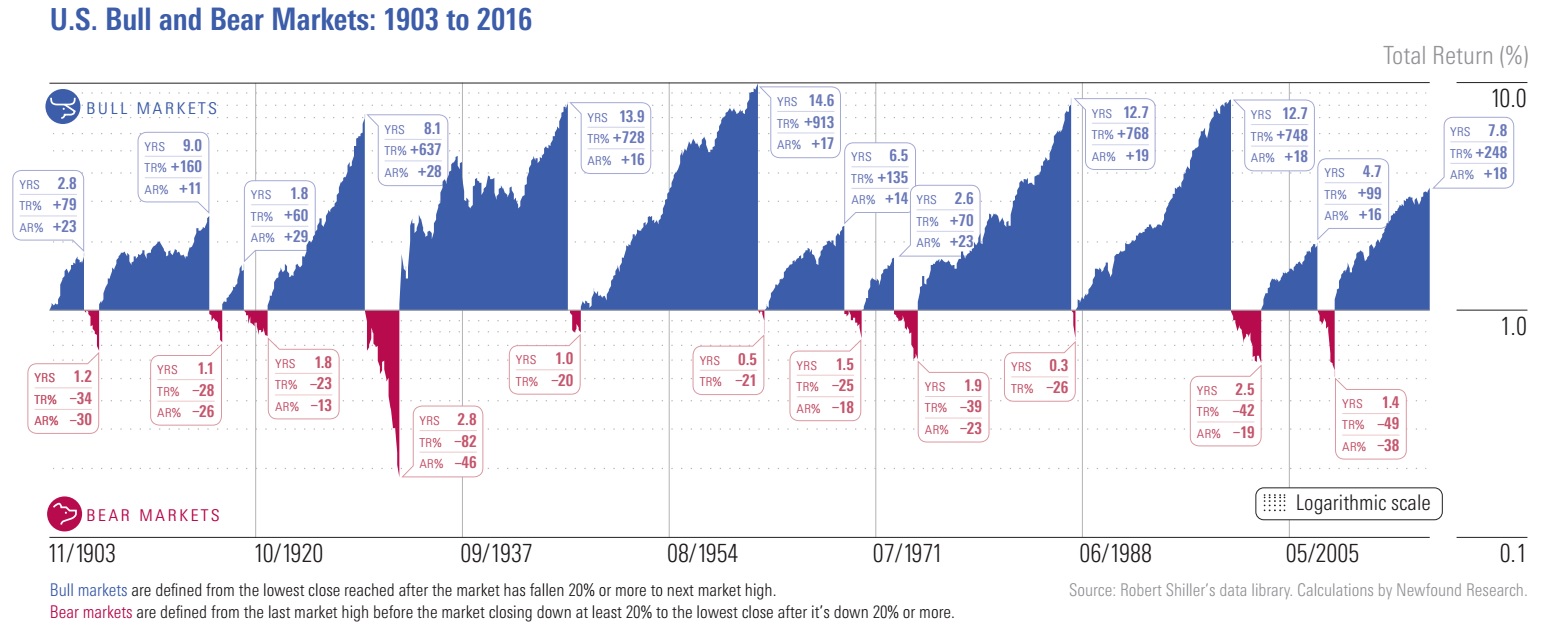
  1. US Bull and Bear Markets From 1903 To 2016:

Click to enlarge

Source: Skloff Financial Group

According to Morningstar, over the period from 1903 to 2016, there were 12 bull markets in the S&P 500. The average bull market lasted 8.1 years, with a total return of 387%. The average bear market lasted 1.5 years, with a total loss of 35%. Hence bear markets are shorter than bull markets on an average.

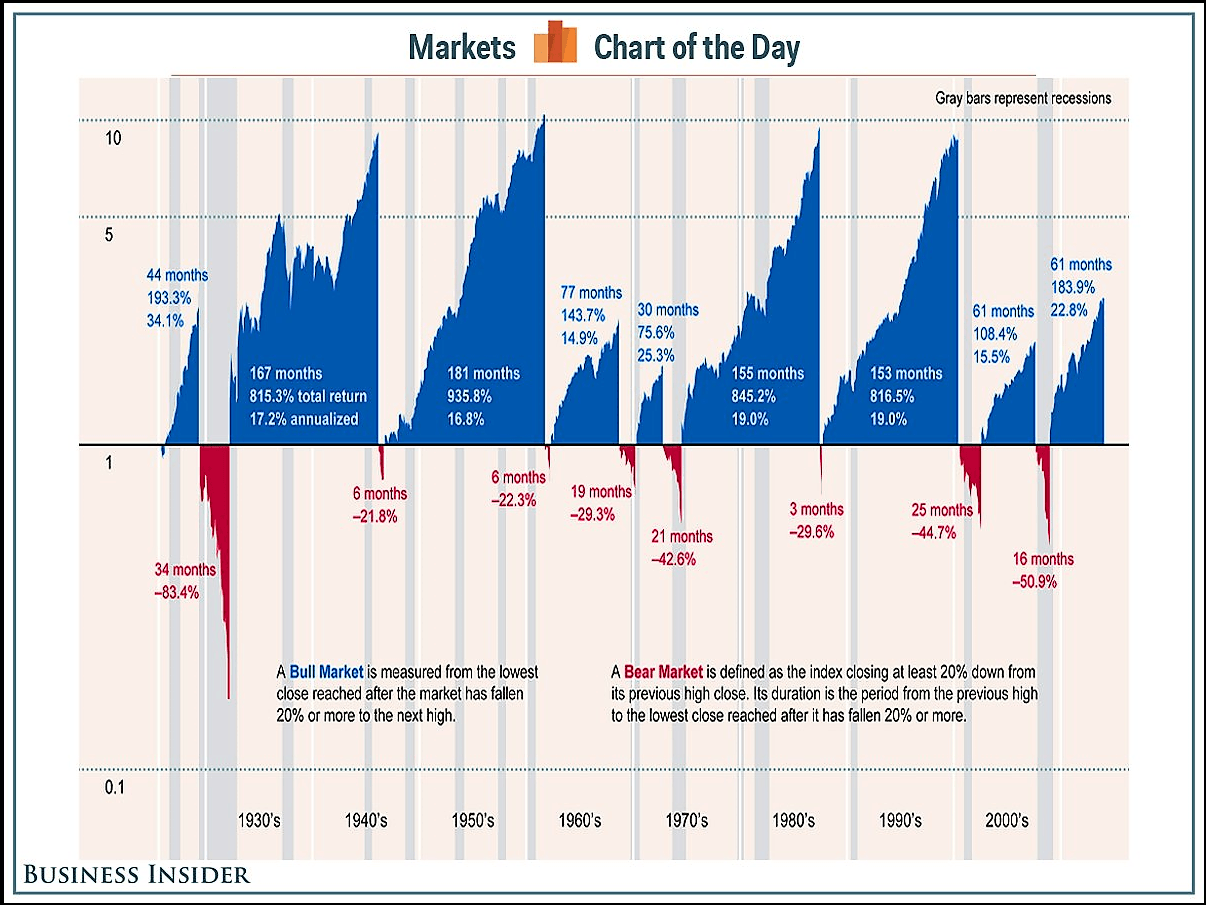
2. History of US Bull and Bear Markets:

Click to enlarge

Source: Business Insider

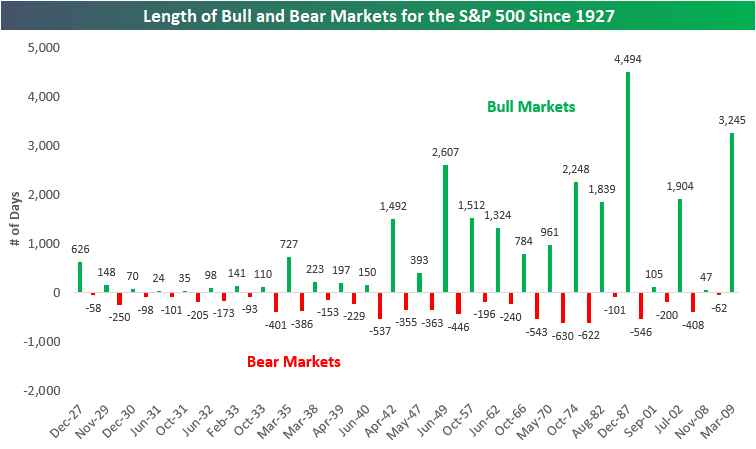
3a. Length of Bull and bear Markets for the S&P 500 since 1927:

Click to enlarge


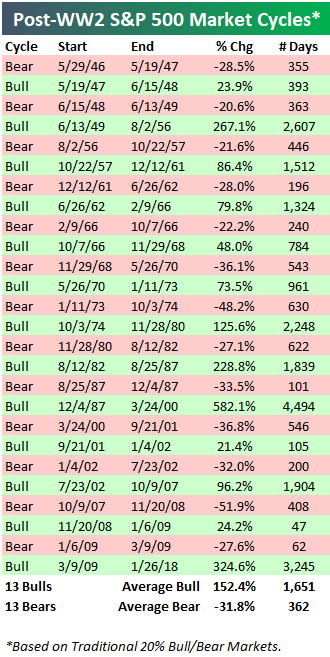
3b.US Bull and Bear Market Cycles post World War 2 based on S&P 500:


Source: Bespoke Investment Group

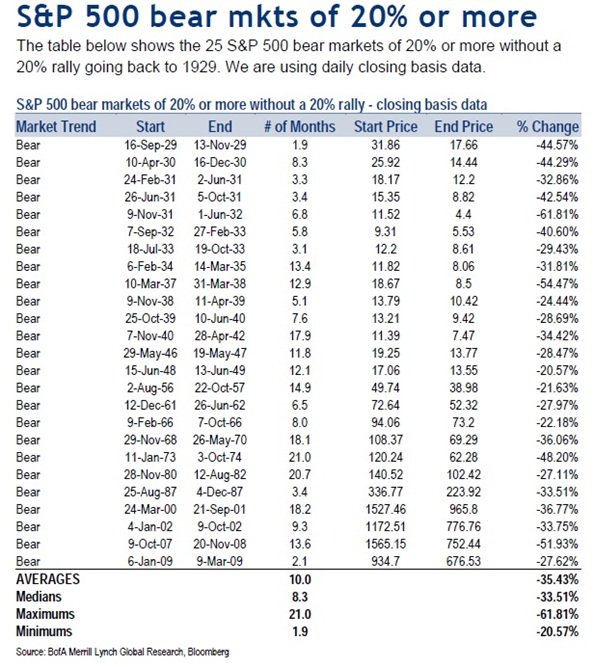
4.Dates of S&P 500 Bear Markets Since 1929:

Click to enlarge

Source: Gold Eagle

Earlier Related Posts:

  1. Half of Global Stocks and S&P 500 Stocks Are Now in a Bear Market, Dec 19, 2018
  2. Stocks Deliver Strong Returns Following Bear Markets
  3. Average Annual U.S. Equity Returns Following Bear Markets: Chart
  4. On the Importance of Diversification During Bear Markets
  5. Total Returns During US Equity Secular Bull and Bear Markets Since 1877
  6. WSJ: Bear Markets are Remarkably Short – Length of Bear Markets Since 1920s 
  7. Bear Markets Are Always Followed By Positive Returns
  8. S&P 500: Bear and Bull Market Price Returns From 1966 To 2017
  9. Past Bull Markets Following Bear Markets: Chart
  10. Cyclical Bull Market in US Stocks Since World War II

Foreign Bear Markets:

  1. Bull and Bear Markets in Canada since 1957
  2. Bear Markets in Australian Stocks since 1900
  3. Duration of Bull and Bear Markets in Indian Stock Market

Pyramid Distribution of US Equity Returns 1825 to 2017

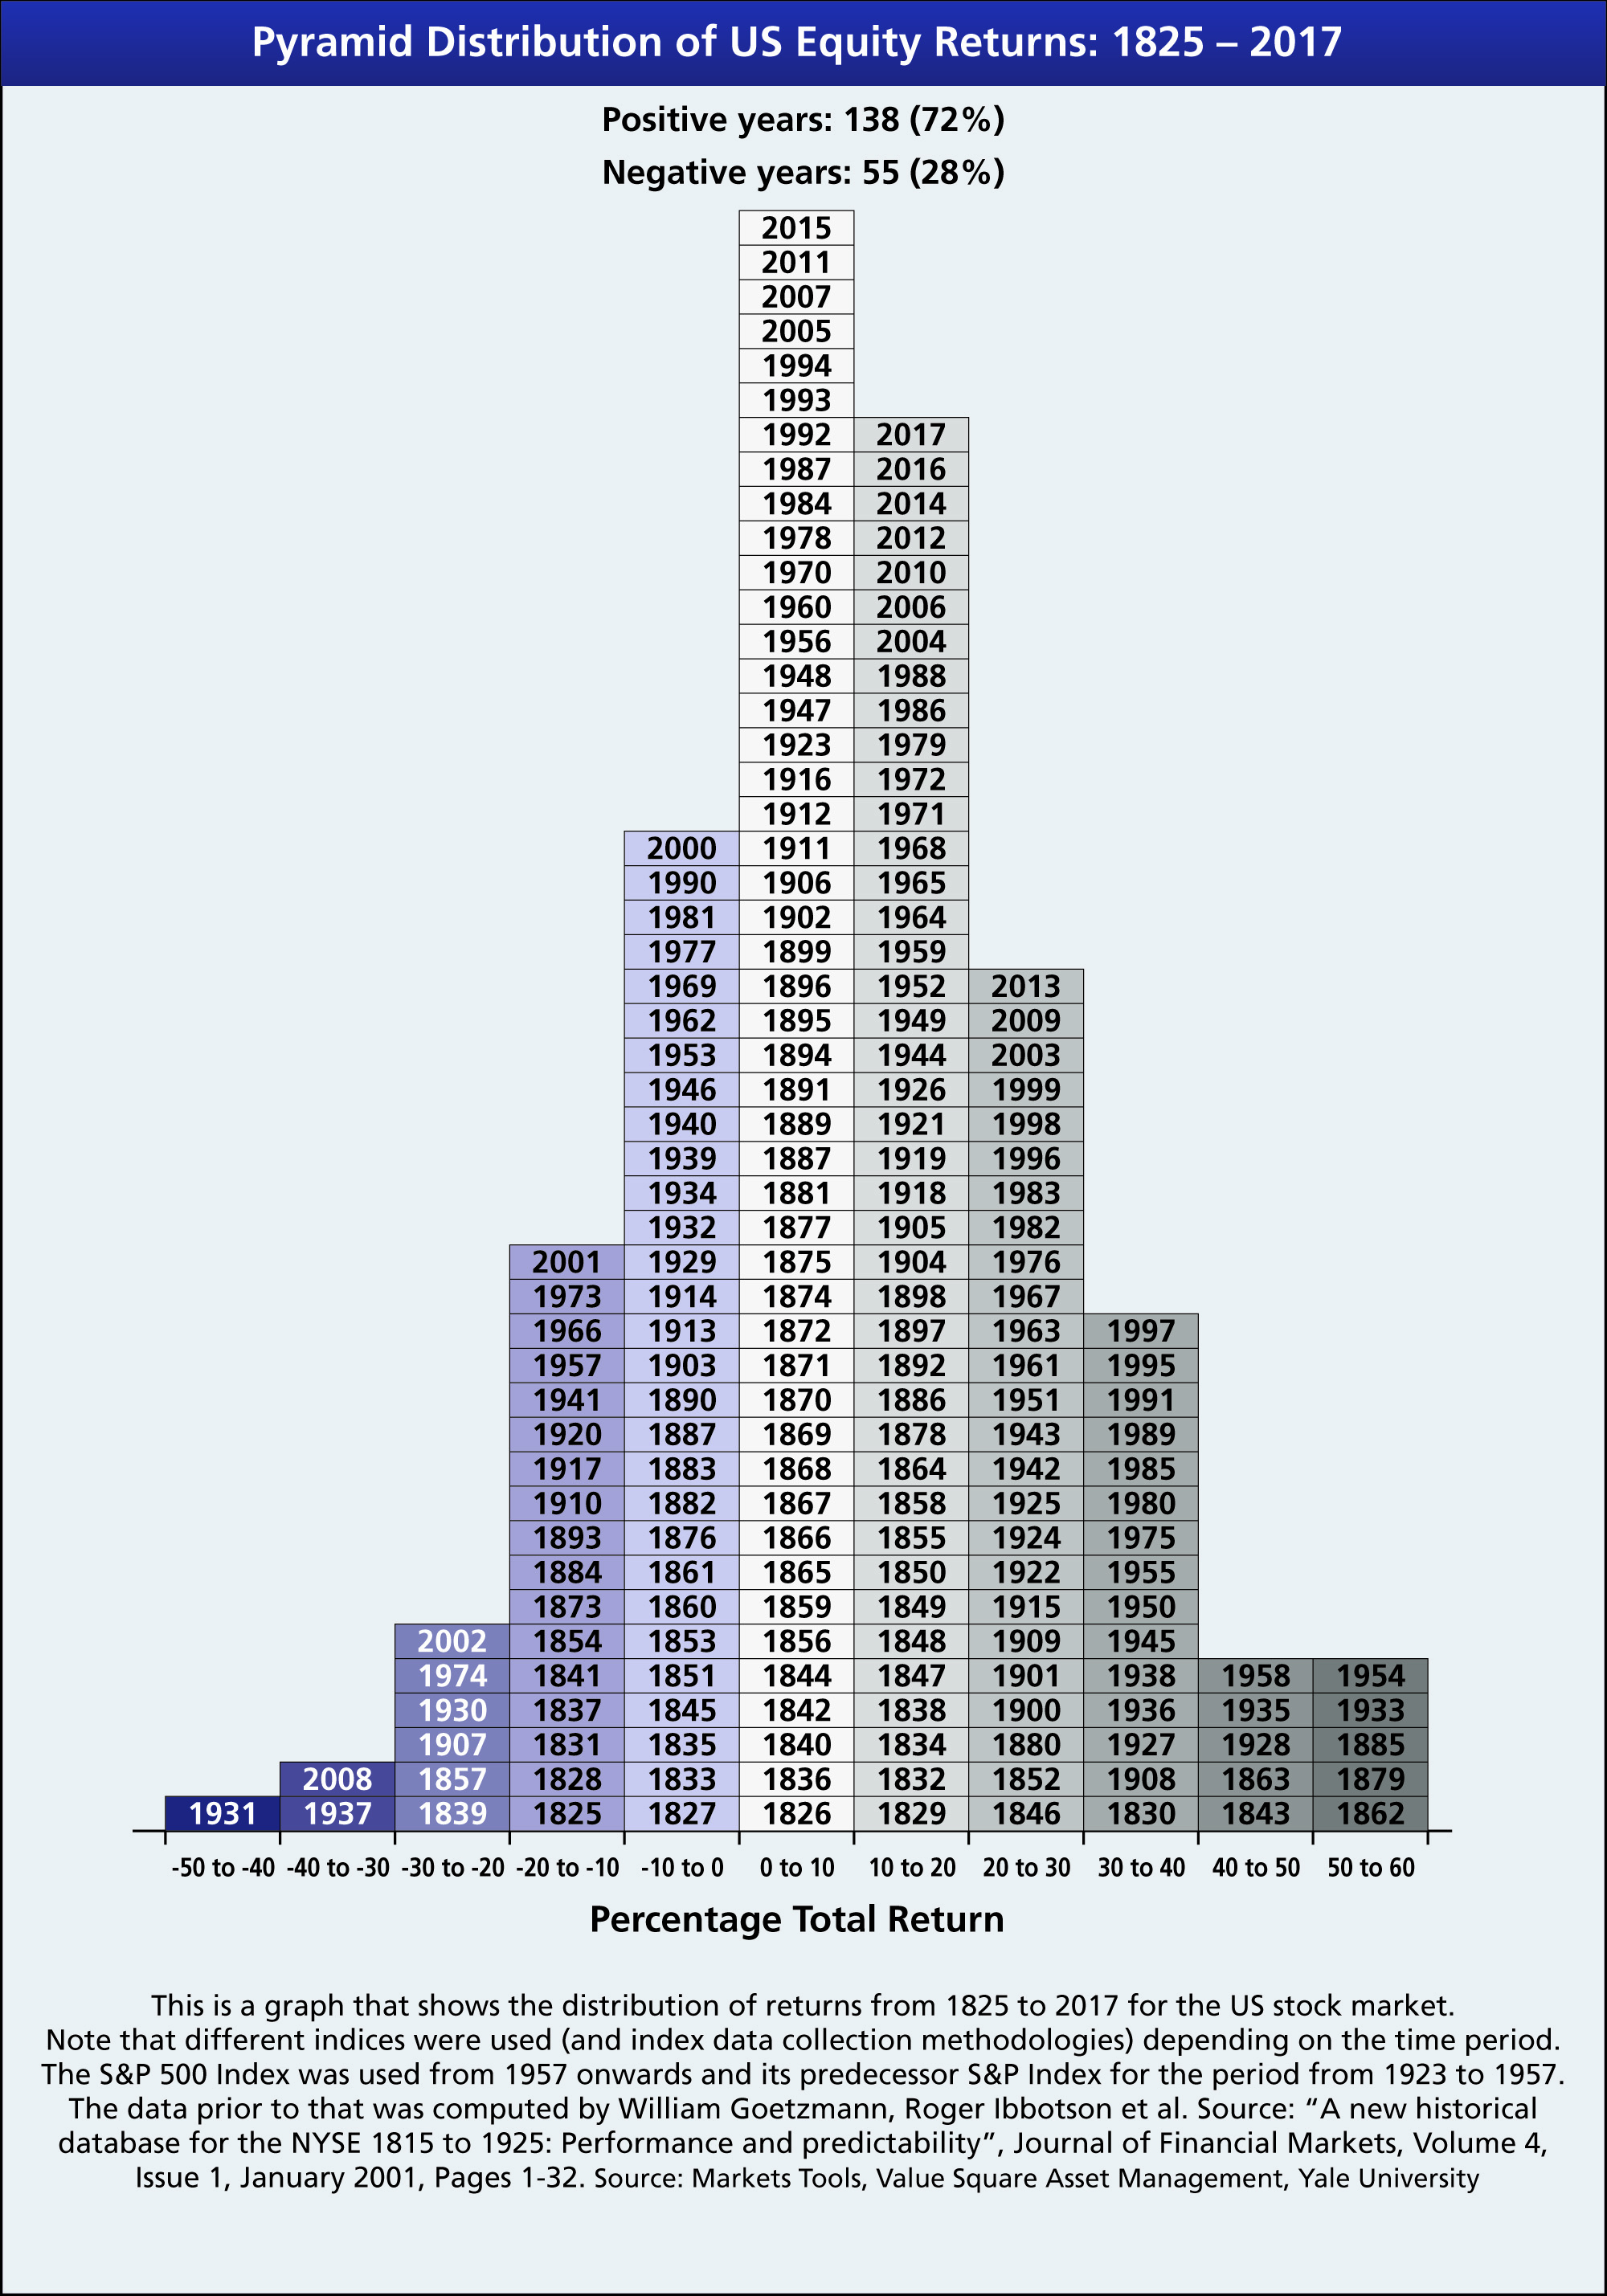
US markets are on track to end the year with negative returns. However over the long run, US equities have had more positive annual returns than negative returns.

The following chart shows the Distribution of US Equity Returns from 1825 to 2017:

Click to enlarge

Note: The returns shown above are Total Returns ( i.e. price appreciation + dividends)

Source:  Via Investment Office

Related ETF:

  • SPDR S&P 500 ETF (SPY)

Disclosure: No positions


Half of Global Stocks and S&P 500 Stocks Are Now in a Bear Market

Many of the major equity markets are in the negative territory year-to-date. The S&P 500 is down by 4.77% based on price alone. But more than half the stocks in the index are down by more than 20% according to a recent MarketWatch article. Similarly half of global stocks are represented in the MSCI World Index are also in a bear market noted a Socgen research report. Investors with cash deploy have definitely plenty of opportunities in the current market.

From an article at Money Observer quoting the Socgen report:

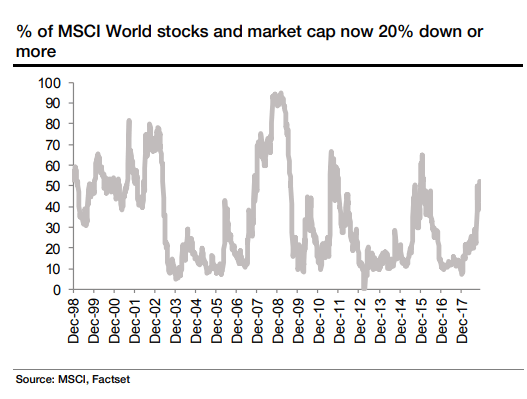
As the chart below from Societe Generale shows, 52% of companies included in the MSCI are now down by over 20% since their 52-week high. Essentially, half the companies on the index are now in a bear market. (Figures taken from a Societe Generale paper published on 10 December 2018.)

The 52% of companies in bear market territory do represent a smaller part of the overall index – in total they account for just 38% of the market cap of the MSCI World Index.

But that doesn’t mean that the broader index has performed well over the past year. As Societe Generale points out, the MSCI World Index is 12.6% down from its late January peak. At the same time, the index’s year-to-date total return is -4.9%, compared to its five-year annualised positive return of 5.7%.

Source: Chart that tells a story: half of global stocks are in a bear market, Money Observer

Below is an excerpt from the Marketwatch piece:

Even after the recent pain in the stock market, the S&P 500 Index is down only 3% in 2018 (excluding dividends). That’s not so bad when you consider the benchmark index rose 19% in 2017.

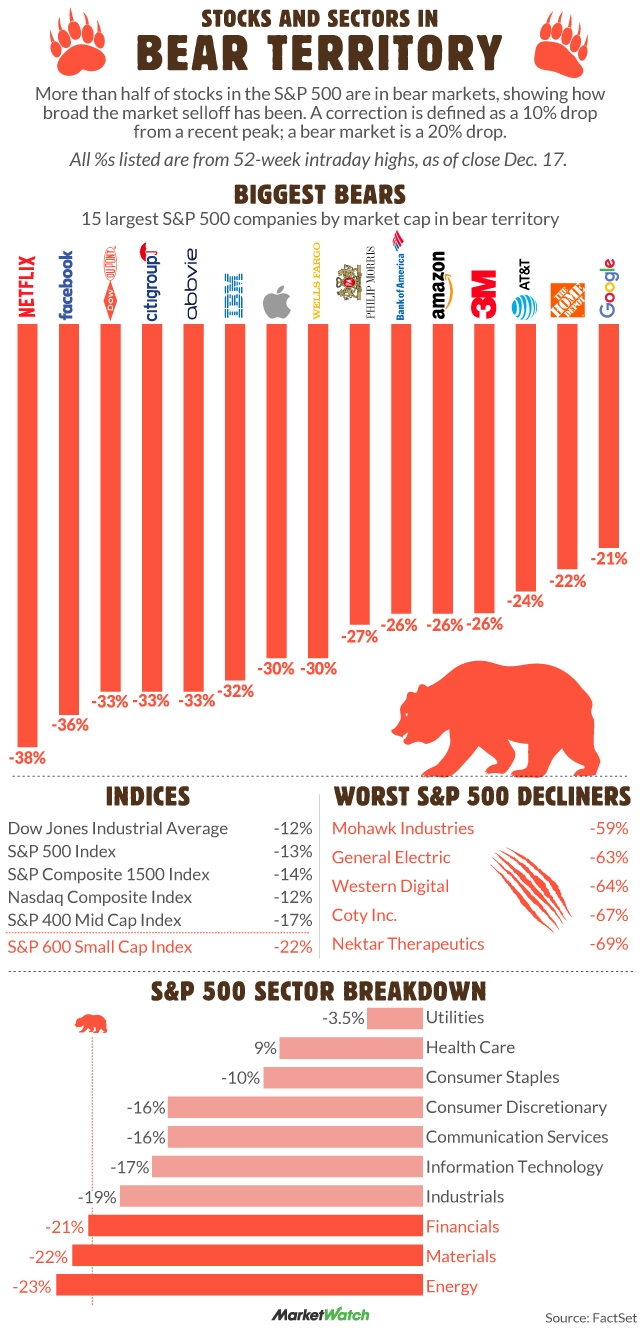
Still, more than half of the stocks in the index are in bear-market territory, showing how broad the decline has been.

A correction is typically defined as a 10% drop for a stock or an index from a recent peak, while a bear market is a 20%-plus decrease. Data supplied by FactSet show that 264 (53%) of S&P 500 SPX, +0.01%  companies are in bear markets.

Source: More than half of S&P 500 stocks are now in a bear market, Marketwatch

The following chart shows that all the 15 biggest companies by market cap in the S&P 500 are in a bear market:

Click to enlarge

Source: All the biggest stocks that are now in a bear market, in one chart, Marketwatch

Disclosure: No positions