Volatility is back in the equity markets with a vengeance. After years of calm and rising markets even a small decline of 2-3% feels like a major fall. Some investors may wonder if we are heading towards a bear market. Even if a corrections turns into a bear market, bear markets usually do not last too long according to research by Schwab. Their research showed that the average bear market last just over a year (505 days). The longest bear market lasted about two and half years but then it was followed by a five year bull market. The data sample used for the study was S&P 500 price returns going back to 1966.
The following chart shows the bear and bull market returns for the S&P 500:
Click to enlarge
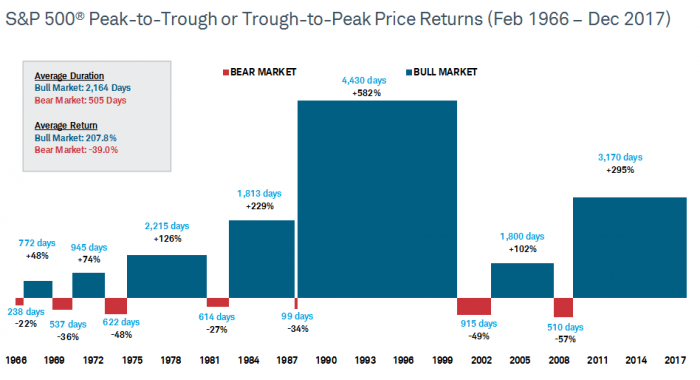
Source: Schwab Center for Financial Research with data provided by Bloomberg. The market is represented by daily price returns of the S&P 500® Index. Bear markets are defined as periods with cumulative declines of at least 20% from the previous peak close. Its duration is measured as the number of days from the previous peak close to the lowest close reached after it has fallen at least 20%. In the chart, periods between bear markets are designated as bull markets. Indices are unmanaged, do not incur fees or expenses, and cannot be invested in directly. Past performance does not guarantee future results.
Source: Volatile Markets: Here’s What You Should Know, Schwab, Feb 9, 2018
The key takeaway is that it is impossible to time the markets. The easiest way to handle the bear is to focus on the long-term and not panic with short-term declines. Over a course of holding stocks for a few decades a long-term investor will invariably face a few bear markets.


