US markets are on track to end the year with negative returns. However over the long run, US equities have had more positive annual returns than negative returns.
The following chart shows the Distribution of US Equity Returns from 1825 to 2017:
Click to enlarge
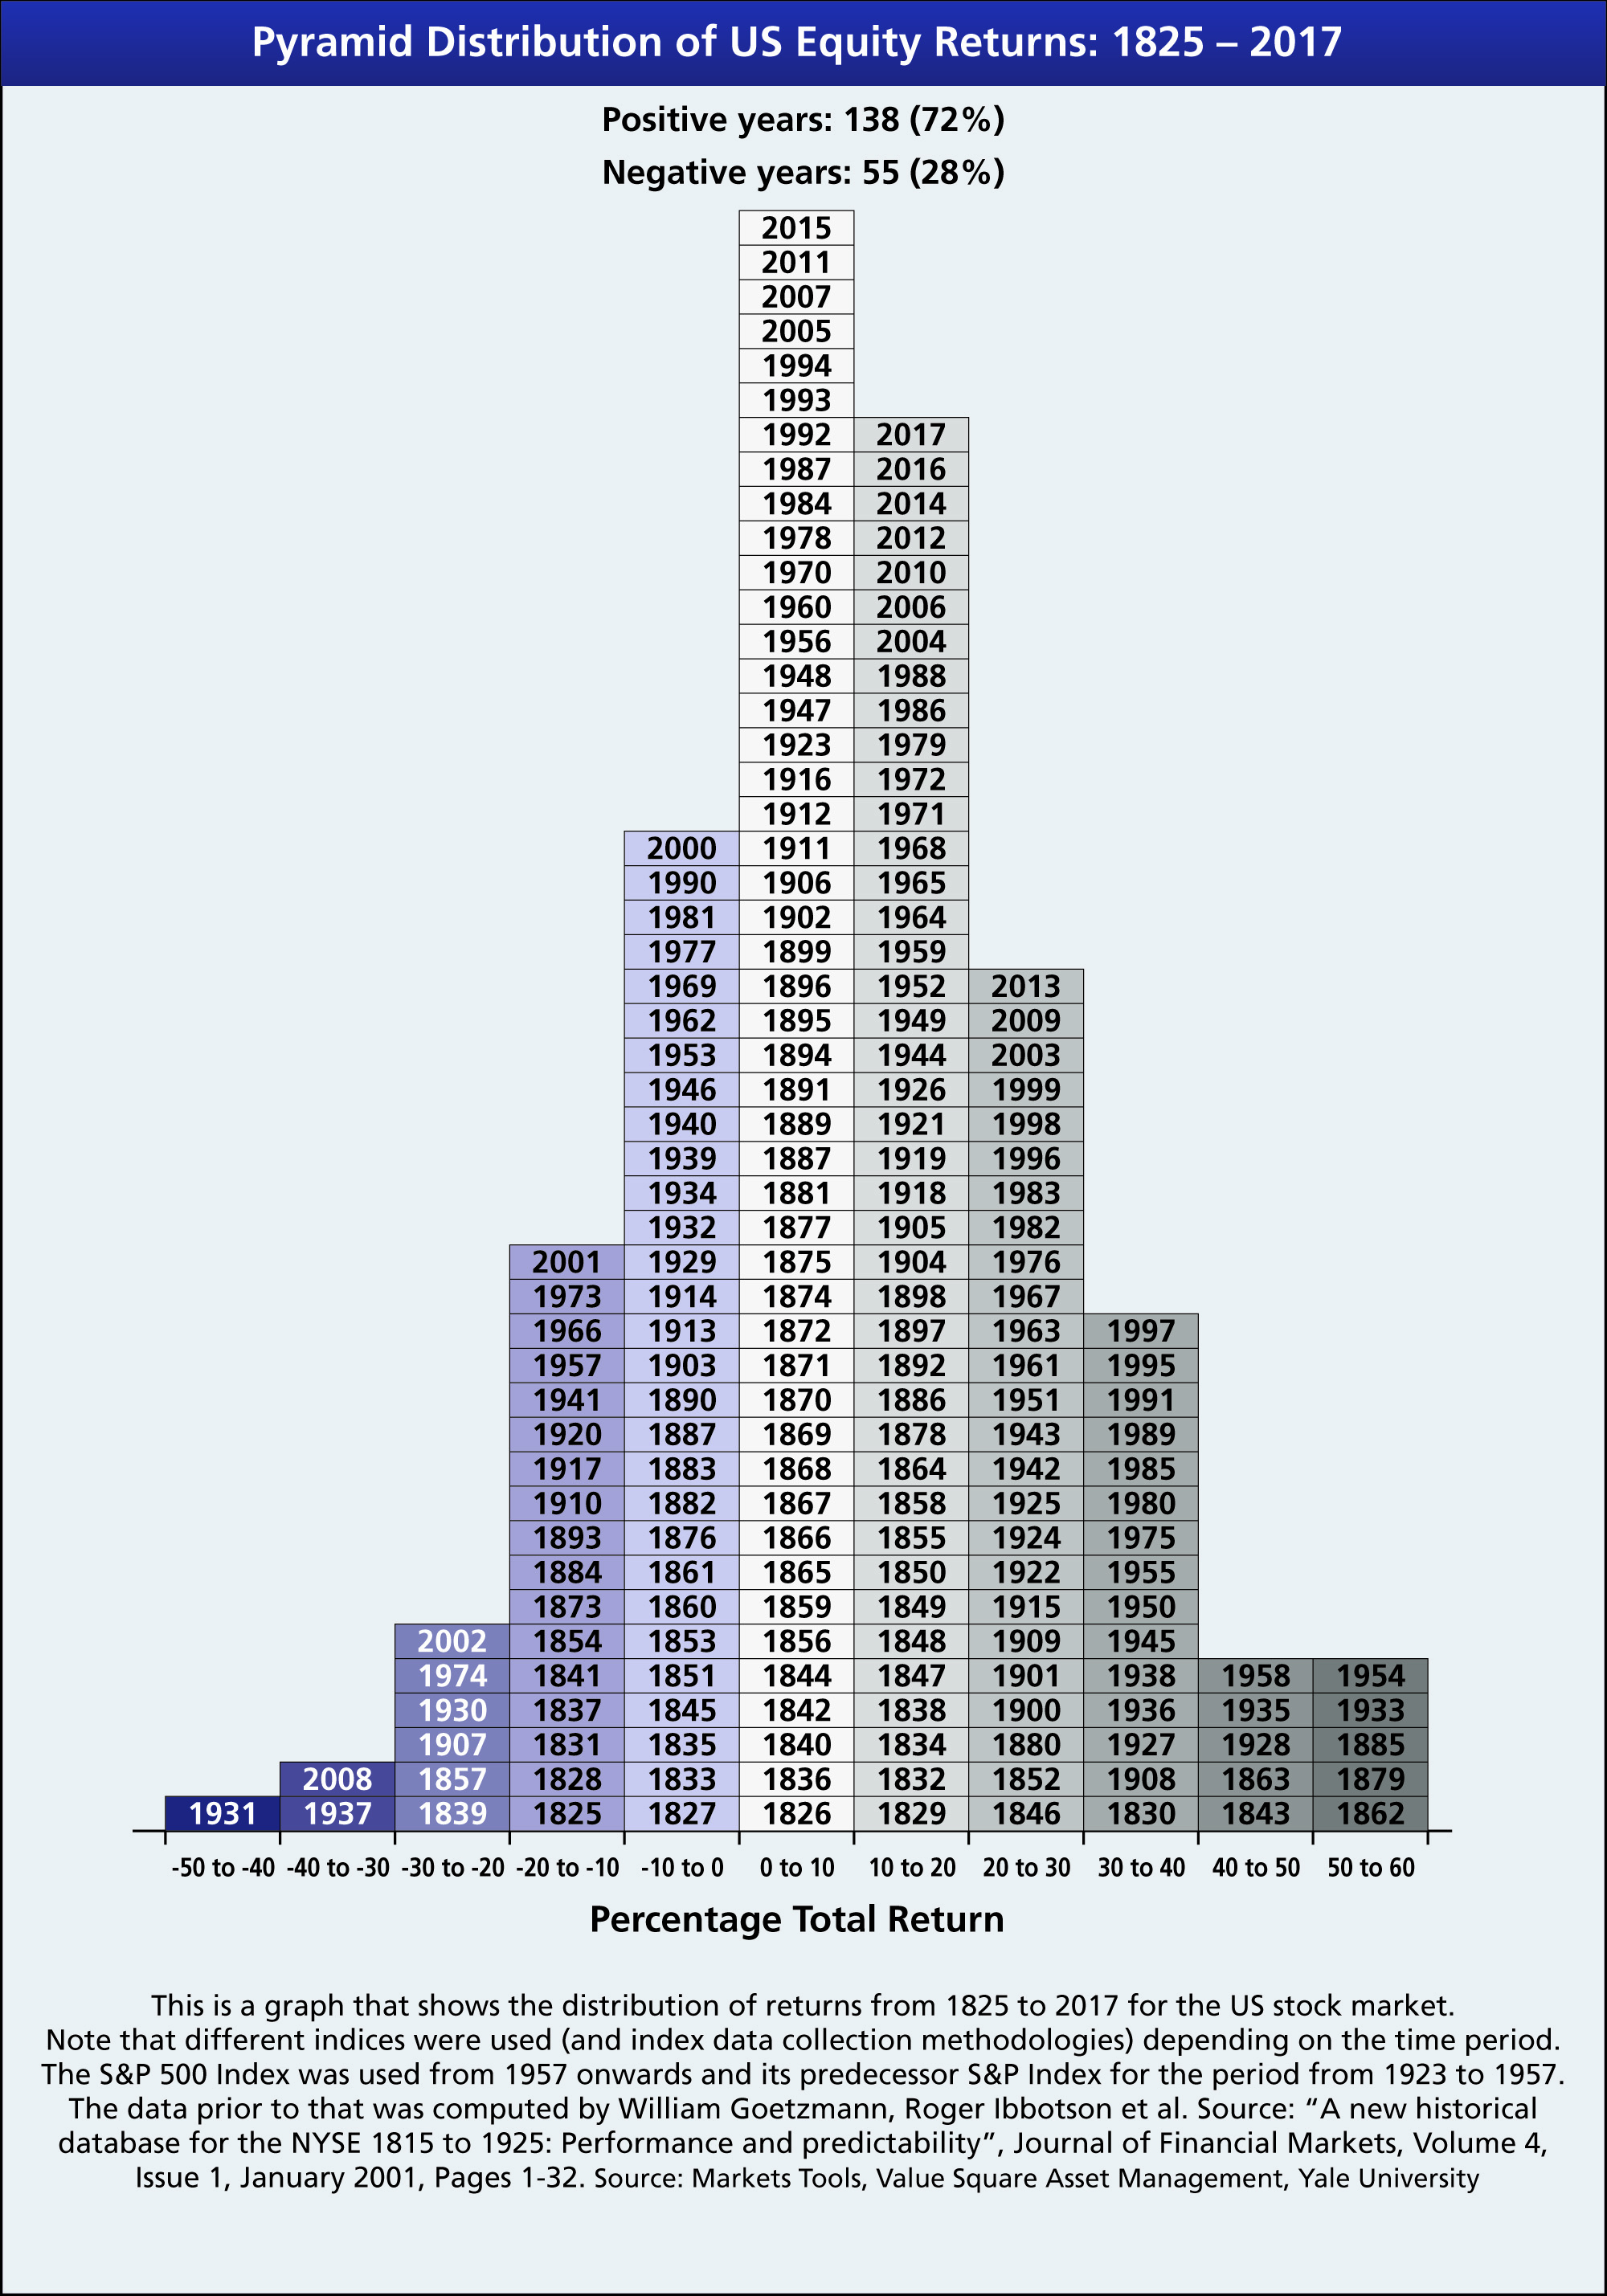
Note: The returns shown above are Total Returns ( i.e. price appreciation + dividends)
Source: Via Investment Office
Related ETF:
- SPDR S&P 500 ETF (SPY)
Disclosure: No positions


