The bull market in US stocks continues to move ever higher. After a short lull during the summer months and big decline last year, investors are bidding up tech stocks like there is no tomorrow. Artificial Intelligence(AI) is just one of the latest technological innovations that is driving these stocks. However investors have to remain cautious and keep an eye on the exit when they fall out of favor. A few articles I read this weekend hi-lighted the growth of this sector and discussed if they are warranted.
Before we get to those articles, for perspective the NASDAQ composite is up by 35% YTD. But the NASDAQ-100 index which constitutes the 100 largest non-financial companies in the NASDAQ have soared by 45% YTD.
Below is an excerpt from an article by Charles-Henry Monchau at Syz Group:
According to the Bank of America chart below, the Nasdaq has reached an all-time high relative to the S&P 500. The current surge has eclipsed the highs of the Internet bubble of 2000 and the peak reached during the bull market of the 1960s. (emphasis mine)
The current boom in the technology sector is fuelled by the very optimistic outlook for artificial intelligence. Will AI deliver on all its promises, or will we soon see a 2001-2002-style backlash?
The Economist magazine published a fascinating article recently titled “Forget the S&P 500. Pay attention to the S&P 493”. From the article:
Think of america’s stockmarket. What is the first firm that springs to mind? Perhaps it is one that made you money, or maybe one whose shares you are considering buying. If not, chances are you are thinking of one of the big hitters—and they don’t come much bigger than the “magnificent seven”.
Alphabet, Amazon, Apple, Meta, Microsoft, Nvidia and Tesla are Wall Street’s superstars, and deservedly so. Each was established in the past 50 years, and five of them in the past 30. Each has seen its market value exceed $1trn (although those of Meta and Tesla have since fallen, to $800bn and $700bn respectively). Thanks to this dynamism, it is little wonder that America’s stockmarket has raced ahead of others. Those in Europe have never produced a $1trn company and—in the past three decades—have failed to spawn one worth even a tenth as much. Hardly surprising that the average annual return on America’s benchmark s&p 500 index in the past decade has been one-and-a-half times that on Europe’s Stoxx 600.
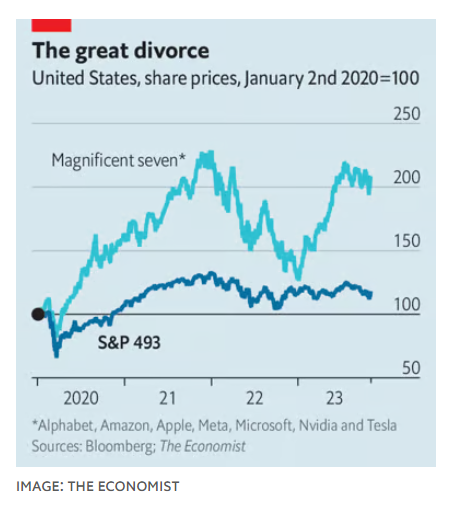
There is just one problem with this story. It is the hand-waving with which your columnist cast the magnificent seven as being somehow emblematic of America’s entire stockmarket. This conflation is made easily and often. It is partly justified by the huge chunk of the s&p 500 that the magnificent seven now comprise: measured by market value, they account for 29% of the index, and hence of its performance. Yet they are still just seven firms out of 500. And the remaining 98.6% of companies, it turns out, are not well characterised by seven tech prodigies that have moved fast, broken things and conquered the world in a matter of decades. Here, then, is your guide to the s&p 493.
The above clearly shows the huge gap in returns between the top seven and the rest of the firms in the S&P 500 index.
The next article on this topic comes from Firstlinks, Australia. From the article by James Gruber and Leisa Bell:
Last year, everyone seemed to have recognized that the prices of many assets had become ludicrous and that their subsequent pummelling was long overdue. However, a number of these same assets have come roaring back to life this year and there’s been barely a peep.
Bitcoin hasn’t not nearly got the same attention and it’s rocketed 135% in 2023. Tech stocks in the US aren’t far behind. Tech bellwether, the NASDAQ, is up a blistering 45% year-to-date. Of the S&P 500, seven stocks aka ‘The Magnificent Seven’ have risen 68% this year, while the remaining 493 stocks in the index are just 2.5% higher.
Here are ‘The Magnificent Seven’ total returns this year:
Nvidia (NVDA) +230%
Microsoft (MSFT) +55%
Apple (AAPL) +44%
Meta (META) +171%
Alphabet (GOOGL) +50%
Amazon (AMZN) +70%
Tesla (TSLA) +74%
At first glance, what’s staggering is how much the prices of these mega-cap companies have moved in one year. Apple and Microsoft are worth US$2.9 trillion and US2.7 trillion, and they’re up 44% and 55% respectively this year. For Microsoft, the market believes that the company is worth around US$950 billion more now than it was at the start of the year. Even with the hype around artificial intelligence, business values moving around this much are difficult to fathom.
Though, perhaps not. Let’s look at the trailing price-to-earnings (PER) multiples of the seven stocks, based on Morningstar estimates:
Nvidia 117x
Microsoft 36x
Apple 30x
Meta 29x
Alphabet 25x
Amazon 75x
Tesla 72x
Simple average 55x
The simple average multiple of 55x compares to the S&P 500’s 24x, a premium of 129%.
Of course, some of the stocks above are set for stellar growth over the next few years. Nvidia, riding the AI boom, is a standout here.
Yet other stocks with high multiples attached are struggling to grow. Apple is one. Another is Tesla where Morningstar expects earnings to shrink this year as competition heats up in the electric vehicle space. And Alphabet faces a serious structural threat to its dominant search engine business from AI.
Have earnings driven stellar tech returns?
I thought it would be a worthwhile exercise to look at how much earnings growth has contributed to the rise in share prices for some of these stocks. For instance, Microsoft’s stock has risen by 861% over the past decade. That’s excluding dividends. Including those, and the stock has compounded at 26% per annum. A stellar performance.
How much of that performance was driven by earnings? Well, earnings per share over that period increased at a compound annual growth rate (CAGR) of 14% on revenue which grew at an 11% CAGR clip. In simple terms, earnings accounted for a little over 50% of the Microsoft’s price rise over the 10 years. The remaining 50% or so came from expansion in the multiple attached to the stock.(emphasis mine)
Back in 2013, Microsoft was considered a stodgy dinosaur and it was valued as such, bottoming with a trailing PER of 13x. How times have changed.
For Apple(AAPL) about 40% of the total return over the past 10 years can be attributed to expansion in earnings multiple.
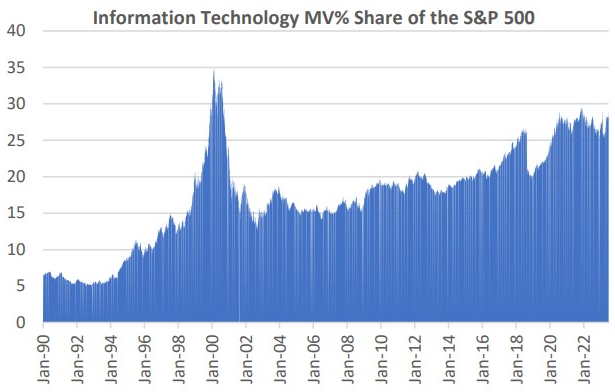
Here is another excerpt which shows that the weighting of the tech sector now has exceeded that of the level reached in 2000.
S&P 500 tech weighting also flashes warning sign
It’s not only the prices of large cap tech stocks that should concern investors. IT’s weighting in the S&P 500 provides further evidence of irrational exuberance in the sector.
On the face of it, the tech sector’s weighting of 28% in the S&P 500 looks high.
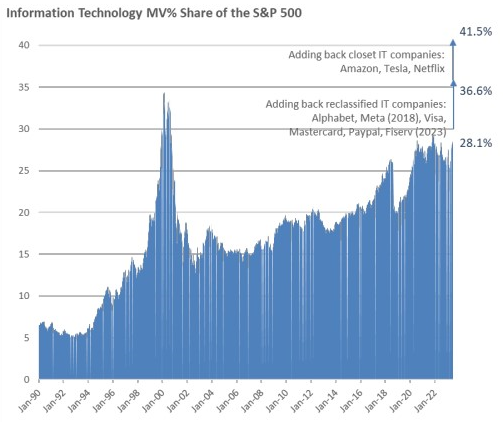
But that doesn’t tell the full story. There are companies that should be part of the tech sector but aren’t. For example, Amazon and Tesla are classified as consumer discretionary when they’re arguably not. Amazon’s cloud business generates 107% of operating profits, which should make it an IT company. In case you’re wondering, Amazon’s online retail business doesn’t make any money (those deliveries are loss makers, after all). Netflix, Alphabet, and Meta are classified as communication companies when they clearly shouldn’t be.
If you include these companies in the tech sector, the true weighting of IT in the S&P 500 is closer to 41%, which is well above the peak of 35% reached in 2000.
The S&P 500 is up over 18% YTD. The tech-heavy NASDAQ Composite has shot up by about 36% YTD. Overall US equity markets have recovered strongly from the crash of 2022. However we may not be out of the woods yet. This is not a bull market. High interest rates are projected to remain high for the foreseeable future and recession is also a possibility next year.
Though the benchmarks have grown by decent double digits this year many individual stocks and a few sectors have soared even more. For instance, “The Magnificent Seven” are in a bull market of their own within the S&P 500. With that said, let’s take a quick look at which stocks reached all-time highs in the last trading session.
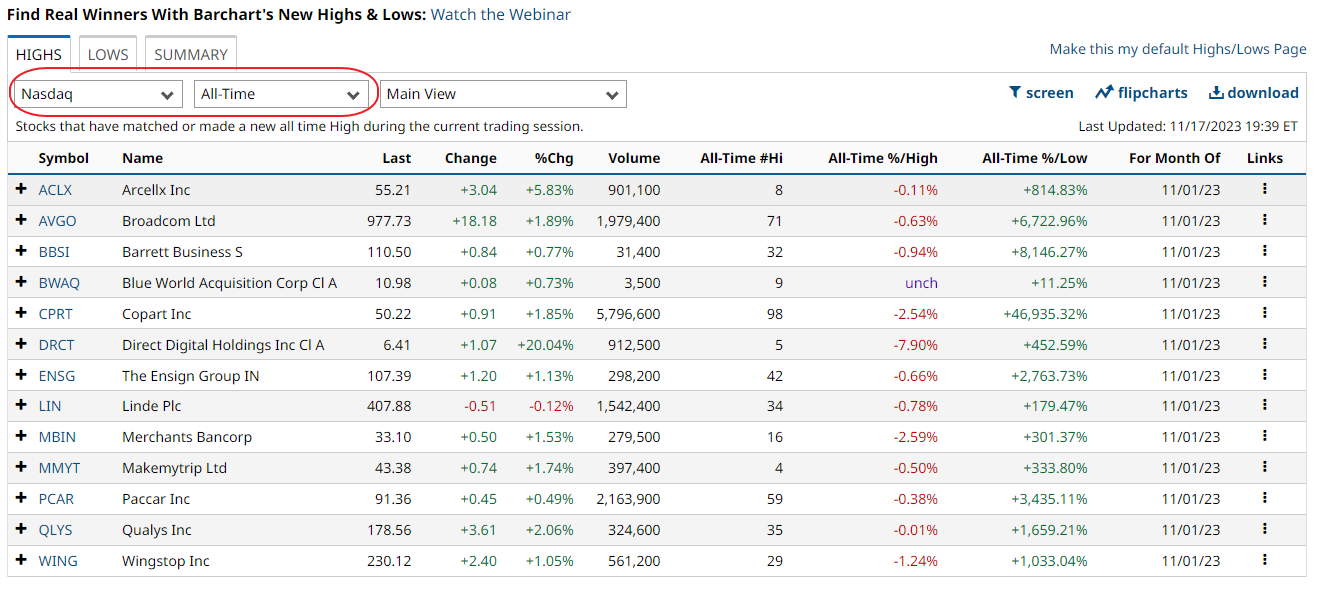
NASDAQ Stocks that reached All-Time Highs on Nov 17, 2023:
Semiconductor maker Broadcom Inc (AVGO) reached an all-time high of nearly $984 on Friday giving it a market cap of over $403.0 billion. The stock is up by 77% YTD and in the past 5 years it has soared an astonishing 325%. Other notables in the above list includes chemical company Linde(LIN) and fast food chain Wingstop Inc (WING). One of the few winners in the banking space this year include Merchants Bancorp (MBIN) of Indiana. The stock is up by 37% YTD.
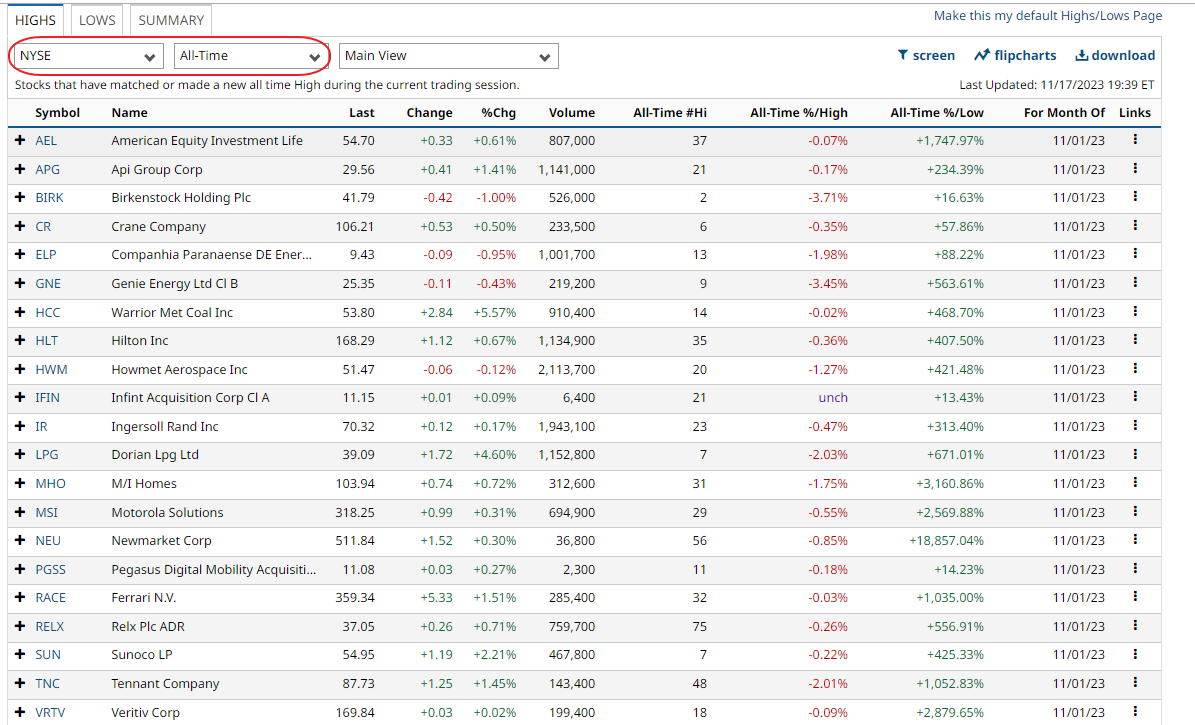
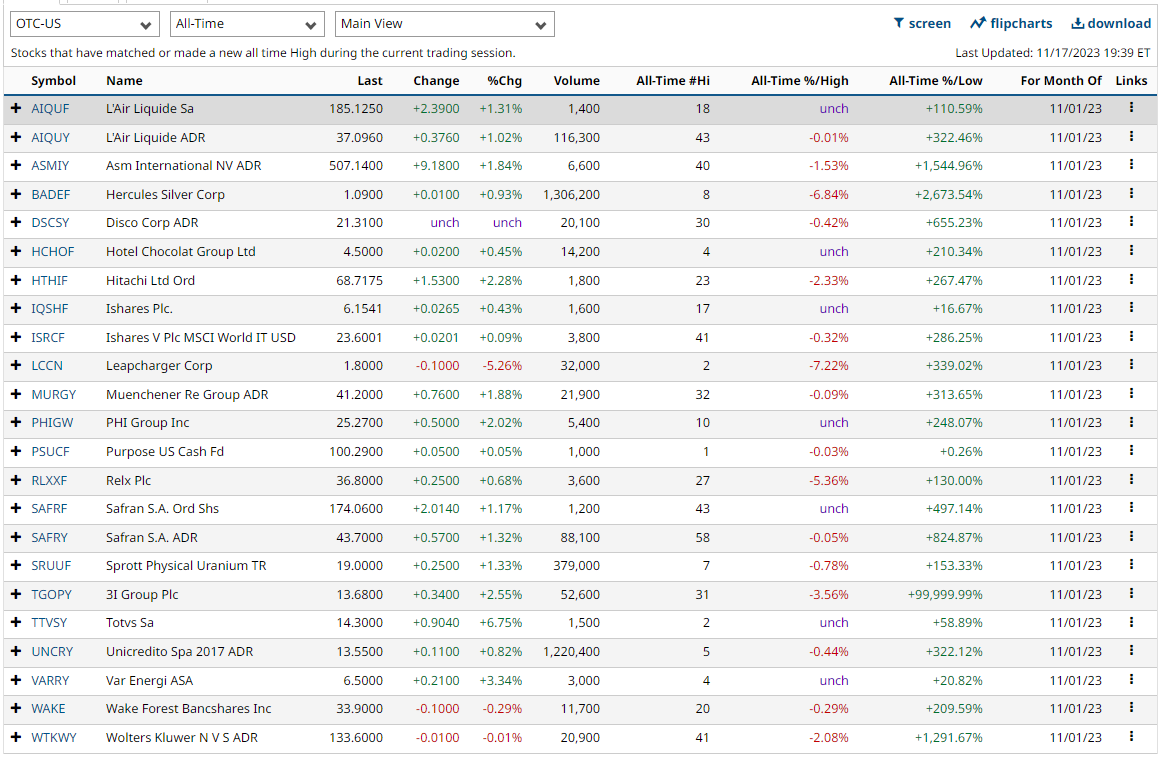
NYSE Stocks that reached All-Time Highs on Nov 17, 2023:
The Finnish Center for Pensions has updated their global retirement age chart for 2022. As in the previous version, the average retirement age in the EU is 65 but is set to increase in 67 in some countries due to higher life expectancy and other factors. Countries such as the Canada, Finland, Norway, Sweden and the US have flexible retirement ages. For these countries the indicated retirement age is the lower age limit.
The chart below shows the current retirement ages (2022) and future retirement ages in select countries:
The S&P 500 is up by over 17% year-to-date on price return basis. In the past 5 year, the index has had an annualized return of 10.52% which is very good. Though equity markets are soaring after a brief lull for the past few months it is always important to keep an eye on the other direction of bull markets. Investors are prone to irrational exuberance and bid up equities to astronomical levels like there is no tomorrow. This year is no different. For instance, semiconductor stocks are in the stratosphere and still going higher. Software stocks are not far behind. From EVs and renewable energies investors have turned their attention to the tech sector and many stocks have soared 50% or more in that sector. It is always a wise idea to be aware of what happens when markets turn their direction.
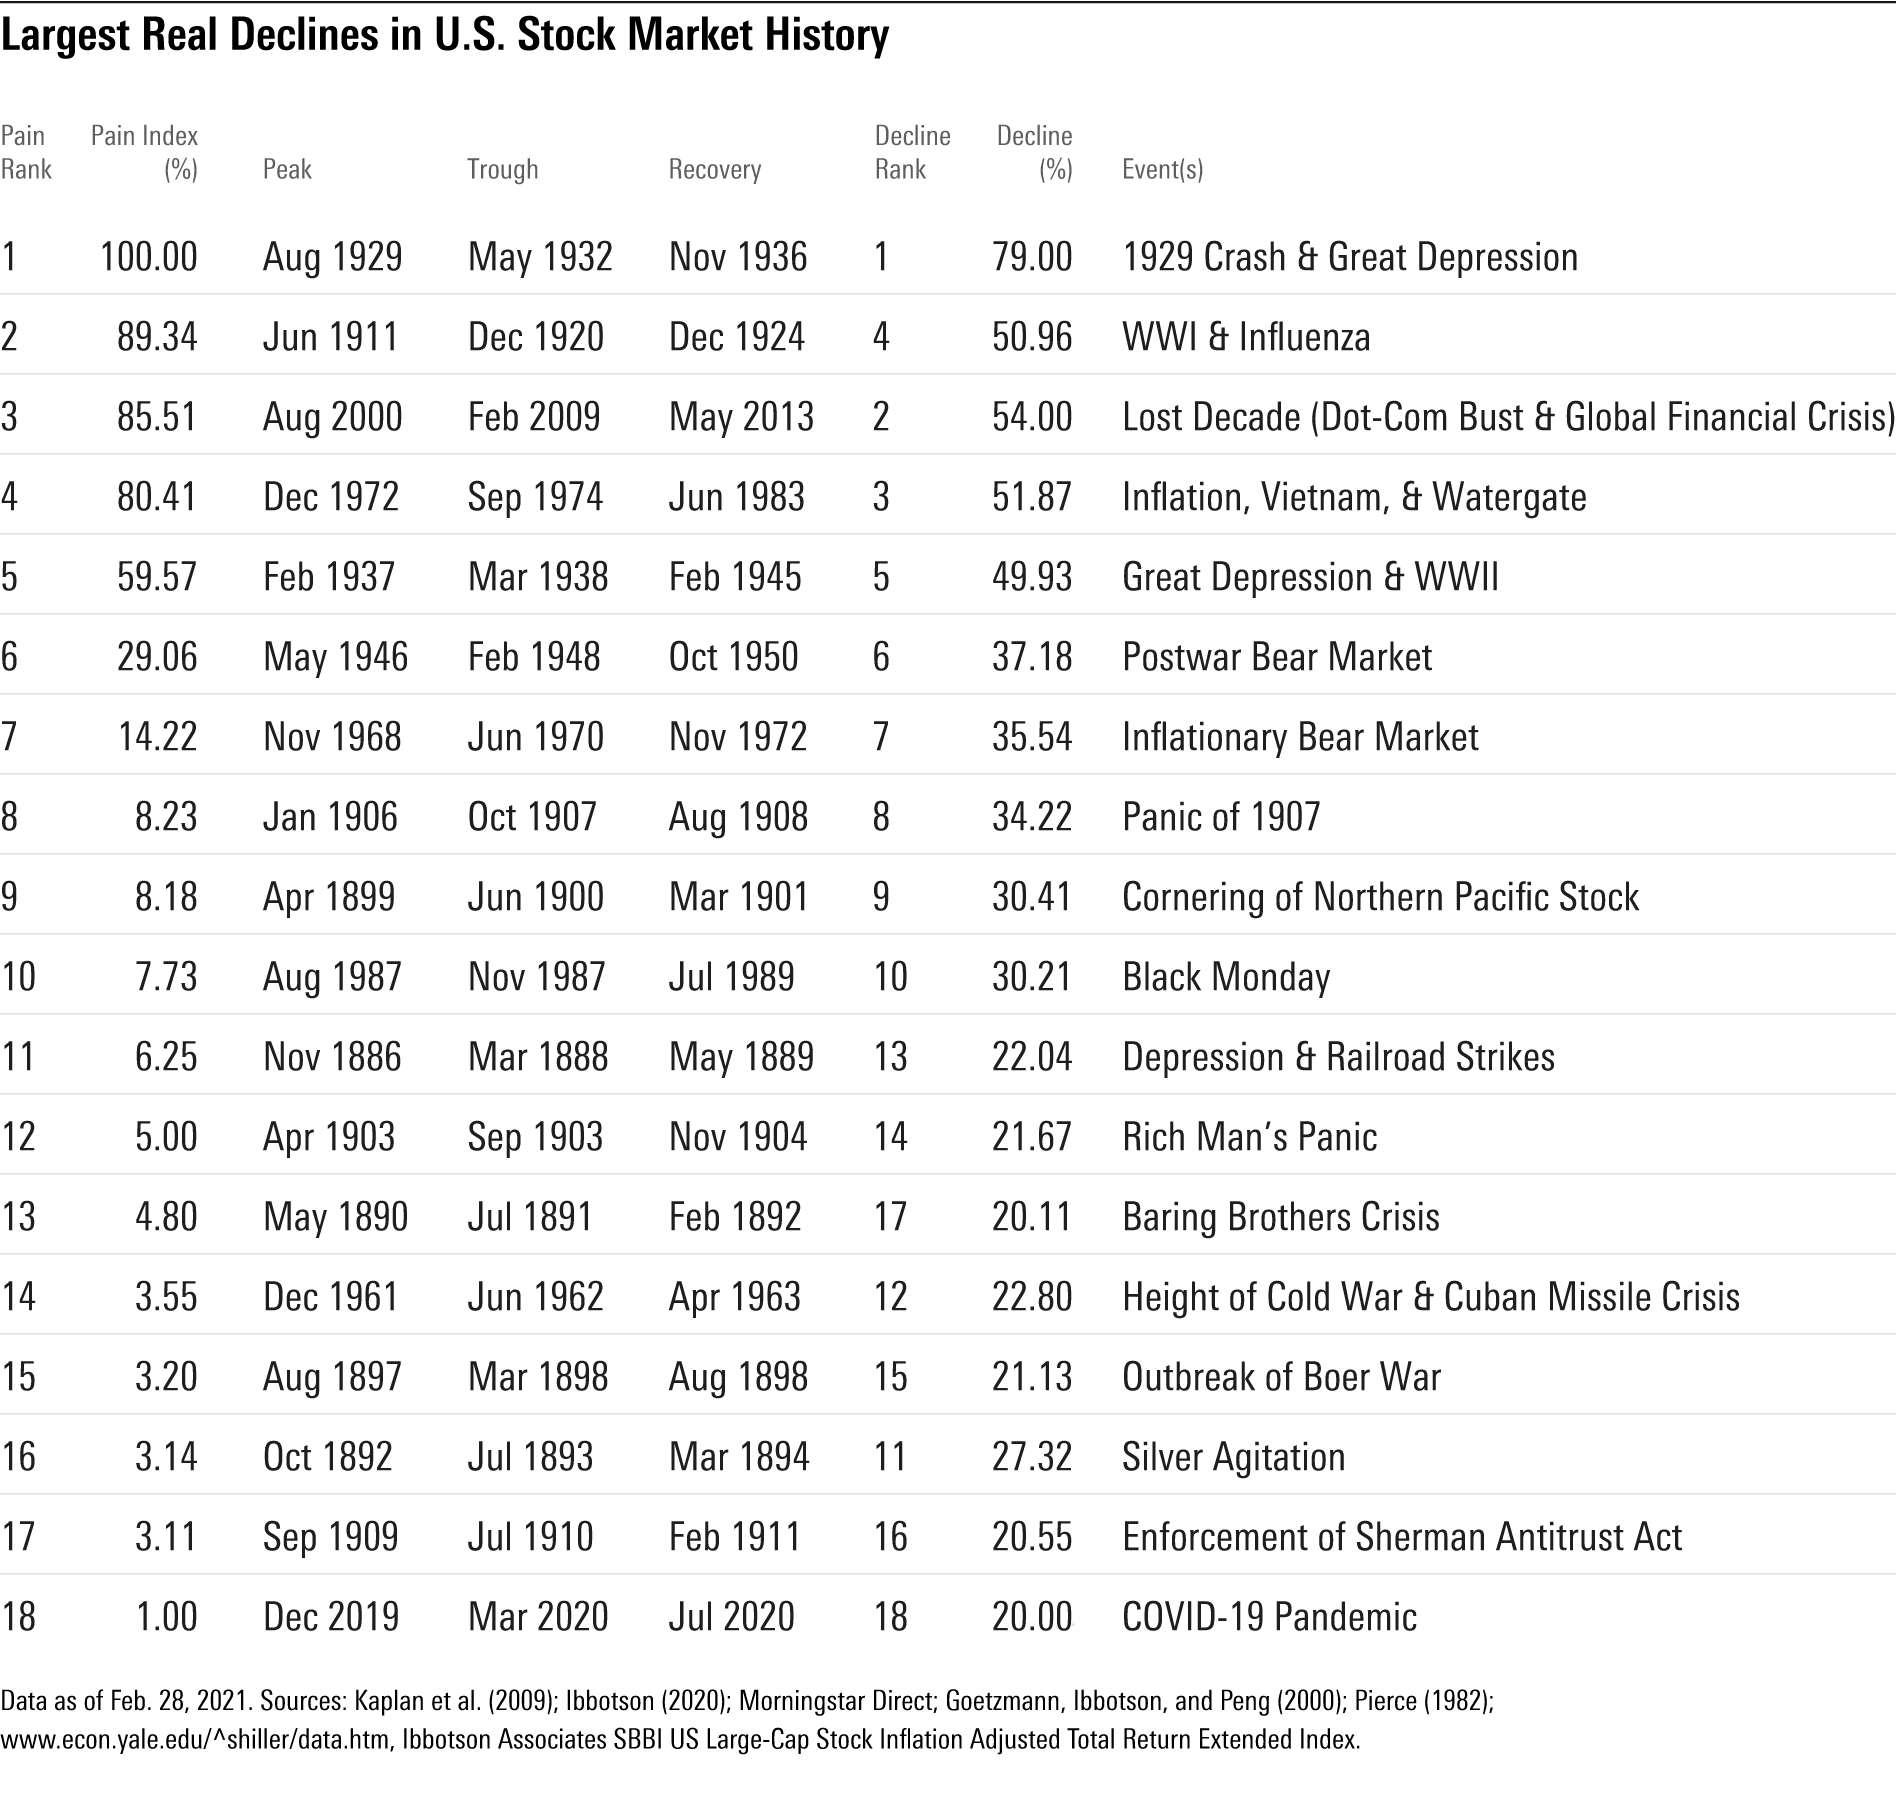
With that said, the below chart shows the largest real declines in US markets. The 20% decline during the Covid-19 panic feels like nothing as markets have recovered strongly since then.
I have written many times in the past on the impact geopolitical crises on equity markets. The overwhelming research shows that markets are more driven by other factors such as earnings, interest rates, inflation, recession, etc. than crisis events. You can find some of the past posts here and here and here and here. Recently while researching on this topic I came across another article at BMO where the authors came to the same conclusion. The following is a brief excerpt from that piece:
Returning to the conflicts in the Middle East and Ukraine, we have long maintained that exogenous shocks tend not to have a long-lasting impact on the markets and that the economic cycle and interest rates are by far the most important drivers of financial asset returns. We stand by that view. Figure 3 shows the market impact of different military conflicts, and the results are clear: a negative initial reaction with a subsequent recovery in the vast majority of cases. Going back to 1940, the median downdraft was 2% in the month leading up to the event, followed by a gain of 10% in the subsequent year.
Figure 3: Market Impact of Major Military Conflicts
The key point to remember is that markets have the ability to sustain all types of external shocks and investors need to focus on their long-term goals and should not make knee-jerk reactions by liquidating a portfolio for instance.