Equity markets have sustained multiple crises over the years and continue to go higher. Though equity markets tend to plunge dramatically when negative events occur they eventually tend to recover slowly. I have written in the past on how US markets have recovered after crises. Some of them can be found here and here and here. The following chart shows the growth of the MSCI All World Index from 1987 thru August, 2023:
Click to enlarge
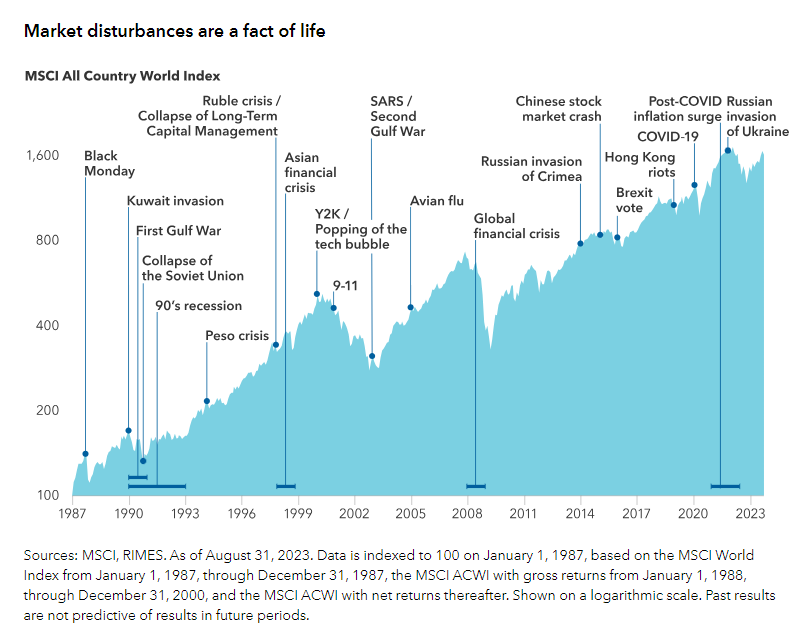
Source: How I survived 23 market shocks in 35 years of investing by Steve Watson, Capital Group
As the chart shows, the index declined when a crisis hit only to regain the losses and go higher later. The Brexit vote panic in recent times was a great time to grab many quality names on the cheap. After years of drama, the British exist from the EU turned out to be a dud.
The key takeaway is that it is always better to deploy cash when markets fall due to some big global crisis.
Related ETFs:
Disclosure: No positions


