The S&P 500 is up by over 17% year-to-date on price return basis. In the past 5 year, the index has had an annualized return of 10.52% which is very good. Though equity markets are soaring after a brief lull for the past few months it is always important to keep an eye on the other direction of bull markets. Investors are prone to irrational exuberance and bid up equities to astronomical levels like there is no tomorrow. This year is no different. For instance, semiconductor stocks are in the stratosphere and still going higher. Software stocks are not far behind. From EVs and renewable energies investors have turned their attention to the tech sector and many stocks have soared 50% or more in that sector. It is always a wise idea to be aware of what happens when markets turn their direction.
With that said, the below chart shows the largest real declines in US markets. The 20% decline during the Covid-19 panic feels like nothing as markets have recovered strongly since then.
Click to enlarge
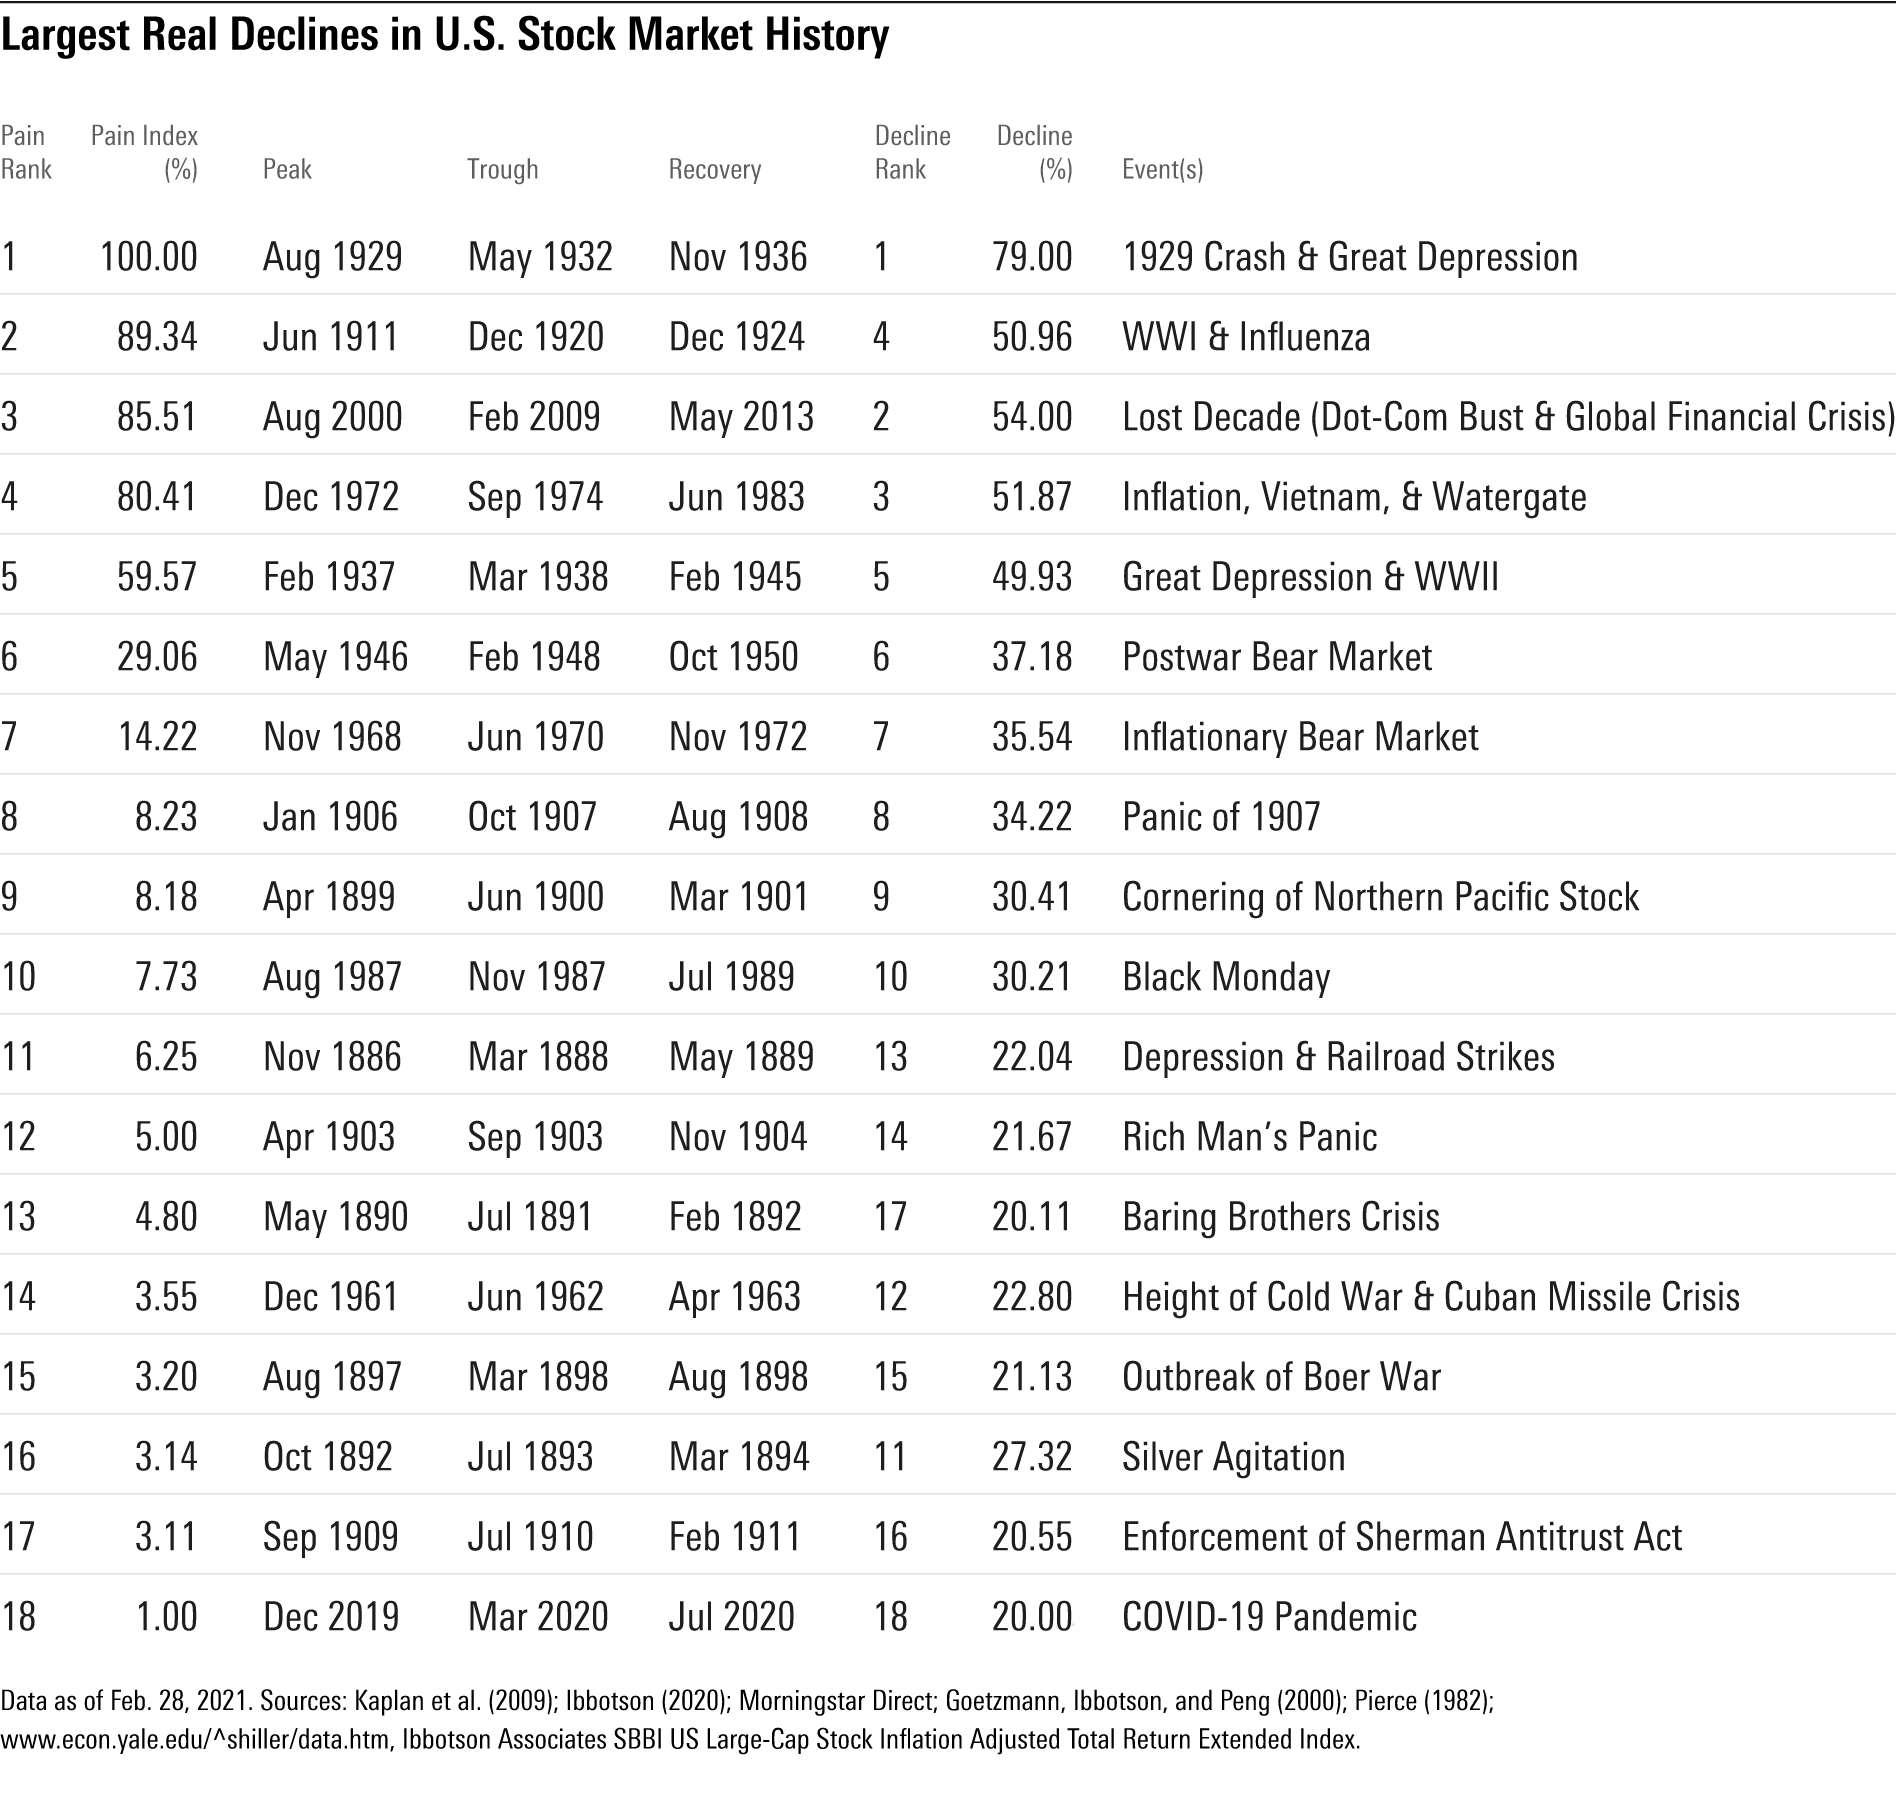
Source: MorningStar via Bogleheads
Related ETFs:
- SPDR S&P 500 ETF (SPY)
- iShares Core S&P 500 ETF (IVV)
- Vanguard S&P 500 ETF(VOO)
- SPDR Portfolio S&P 500 ETF (SPLG)
Disclosure: No positions


