High Losses Require Even Higher Gain To Break Even: Chart

The US equity market has been up strongly almost every year for the past few years. While gains are nice it is also important to remember that stocks do not always generate positive returns. To put it another way, losses are a feature of investing in the markets and investors have to deal with them in a wise manner.

When a stock in an investor’s portfolio is at a huge loss it is not easy to recover the losses easily. If the percentage of loss is higher the percentage of gains required to break even is even higher. For example, if a stock goes from $10 to $5 that is 50% loss. However an investor has to earn more than 50% to get to the break even price of $10. It is not enough for the stock to recover by exactly 50% to reach the break even price of $10. A 50% rise would put the price at just $7.50 ($5 + $2.50 (50% of $5). So to get to $10, the stock has to double or rise by 100%. This is where it gets tough to say the least. So the key point to remember is as the percentage of loss increases the percentage of gain required to get even increases exponentially.

The following neat chart shows this critical concept figuratively:

Click to enlarge
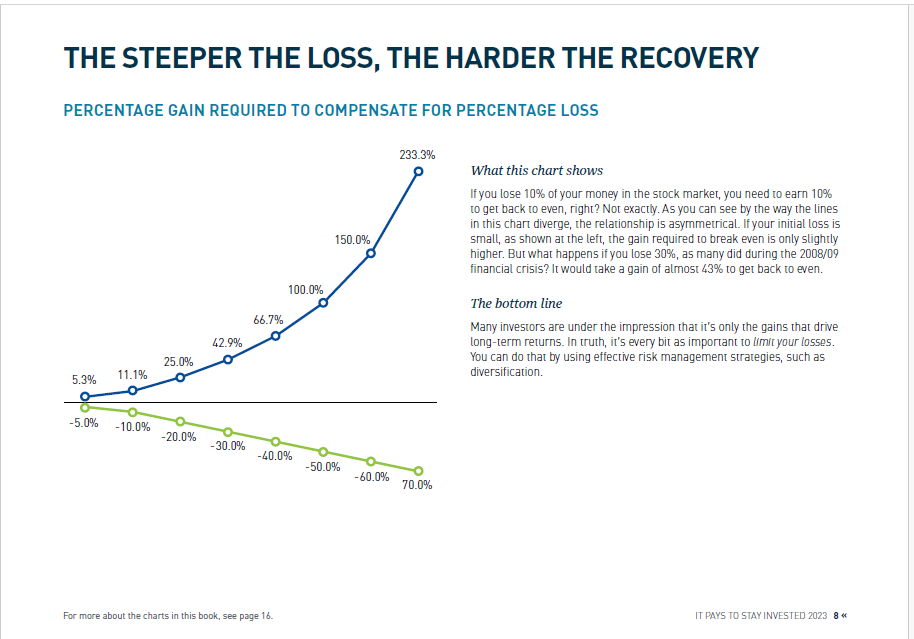
Source: It pays to stay invested, Northwest & Ethical Investments L.P.
Bitcoin: The Best Performing Asset Class So Far This Year

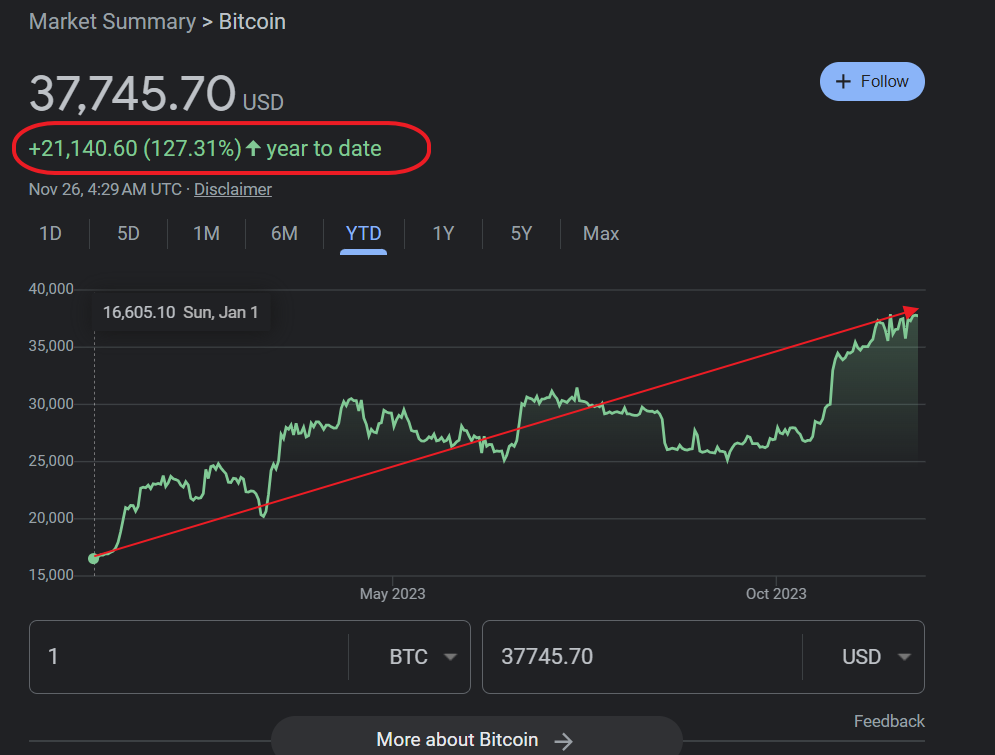
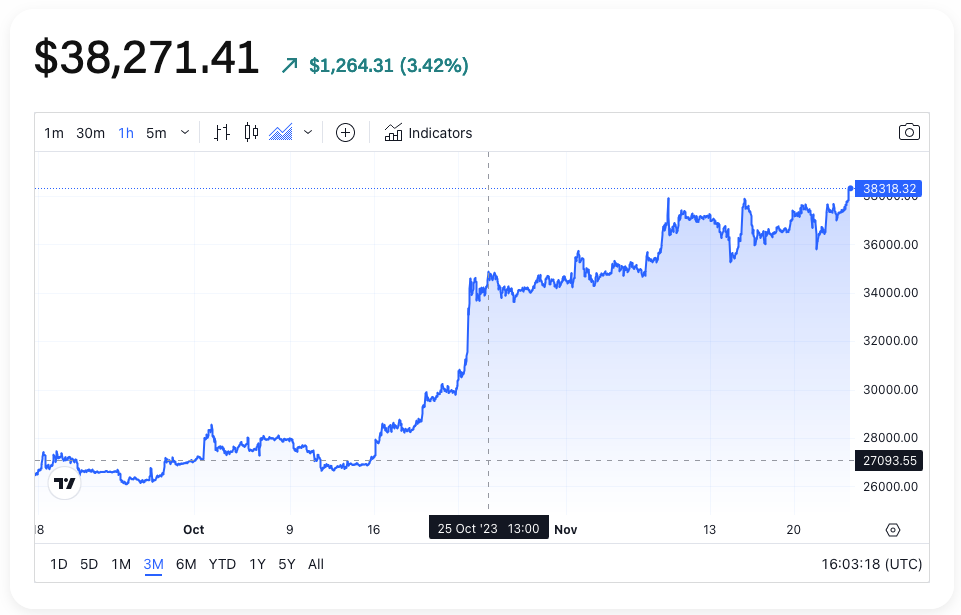
Bitcoin has soared more than 100% since the start of the year. Yesterday its price crossed the $38,000 mark according to The Block as shown in the chart below. Bitcoin prices were around $16,600 in the beginning of the year.

Click to enlarge

Source: Bitcoin price breaks past $38,000, carried on by ETF hype, The Block

The following chart shows the development of Bitcoin YTD as per Google Finance:

Click to enlarge

Source: Google Finance

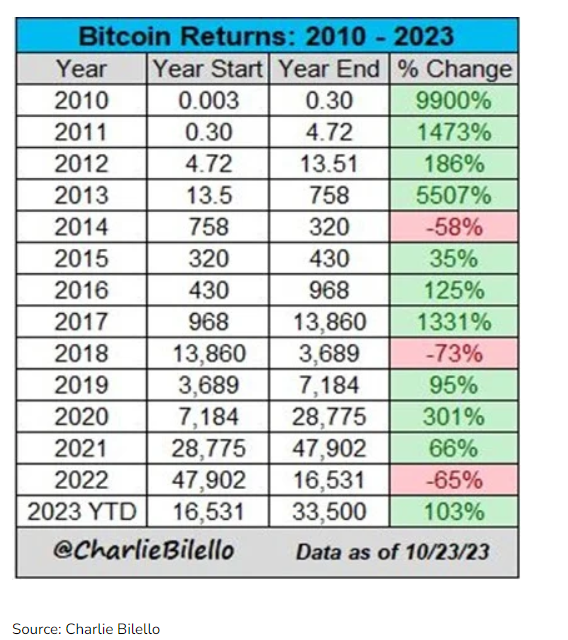
The following table shows bitcoin historical annual returns from 2010 to 2023:

Click to enlarge

Source: @CharlieBilello via syz Group

Disclosure: No positions

Calendar Year S&P 500 Index Returns 1928-2022: Chart

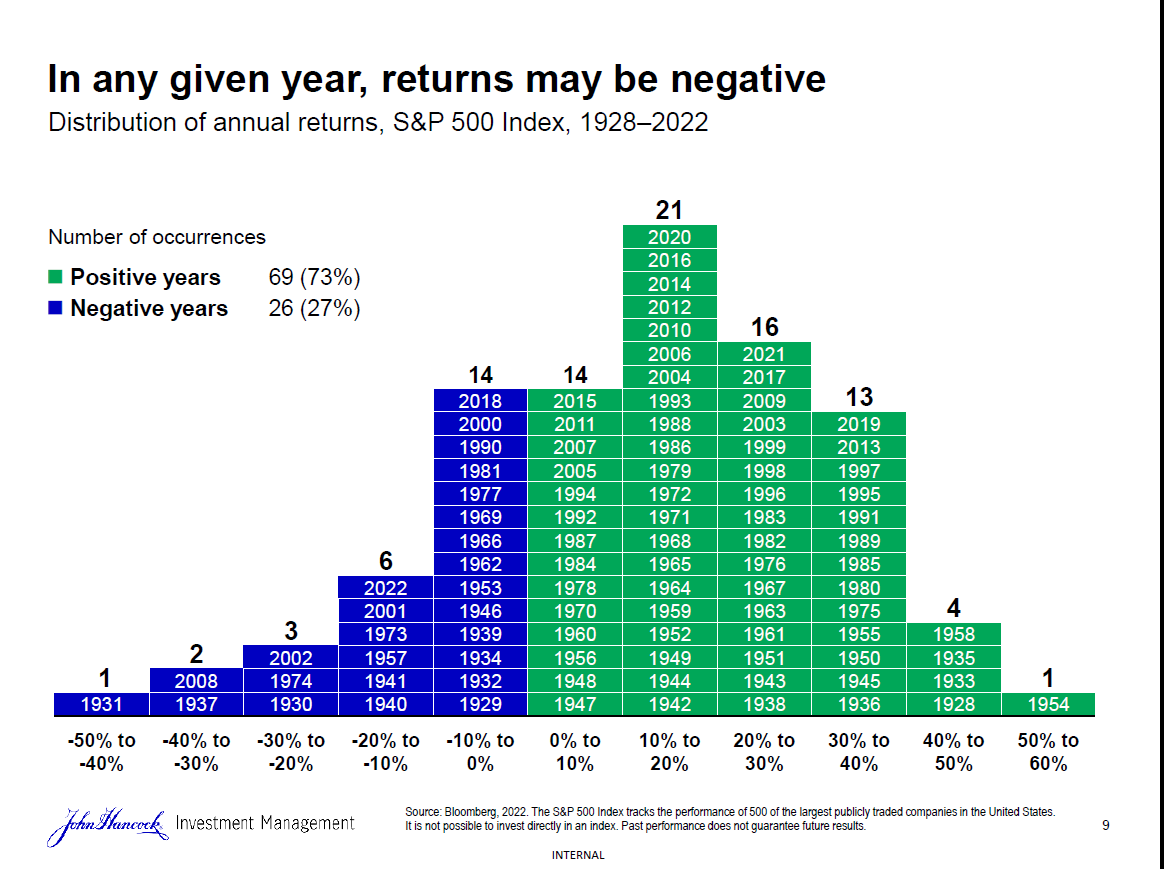
I have written many times in the past that investors should keep their long-term goals in mind and not worry too much about short-term gyrations of the market. While markets may be down one year they can come back roaring the next year. For instance, the S&P 500 was down over 20% in 2022 but this year it has recovered strongly. The following chart shows the importance of the need to maintain a long-term view with equity investing. The annual returns of the S&P 500 index from 1928 to 2022 shows that the returns were positive 73% of the time and negative only 27% of the time. In addition, when returns where positive it was more than 10% in majority of the years shown.

Click to enlarge

Source: 10 things every investor should know about investing workbook, John Hancock Investments

Related ETFs:

  1. SPDR S&P 500 ETF (SPY)
  2. iShares Core S&P 500 ETF (IVV)
  3. Vanguard S&P 500 ETF (VOO)
  4. SPDR Portfolio S&P 500  ETF (SPLG)

Disclosure: No positions

Why Retail Investors Should NOT Follow Warren Buffett for Managing Risk

Billionaire Warren Buffett is one of the most celebrated investors of all time. He is often hyped by the media for his greatness and some loyal followers almost worship him as if he is the god. However he is not all that hyped up to be. It can be argued that he is riding on his old glory and ordinary investors do not have to follow his every move. One does not need to be rocket scientist to understand that much of his Berkshire Hathway’s revenue comes from insurance. In the insurance business, billions of dollars flow in on a regular basis and the company gets to invest the funds as it wishes. A recent report noted that the company has accumulated a cash pile of over $157.0 billion.

With that said, retail investors absolutely should not follow Mr.Buffett in managing risk. This is because he does not believe in diversification in the true sense of thee word. He makes concentrated bets and hopes to win huge. If he wins even with one or two such bets the outsize returns would erase the losses from other fails and he can claim he is a true genius. Unlike him, retail investors do not have luxury of making concentrated bets on a few stocks for the simple fact that they cannot afford their investment.

A recent article by Charles-Henry Mochau at syz Group discussed how diversification is not one of Mr.Buffett’s principles. From the piece:

This is how the Oracle of Omaha manages risk. Instead of diversifying portfolios excessively, he takes highly concentrated bets on companies for which his level of conviction and knowledge is very high. 

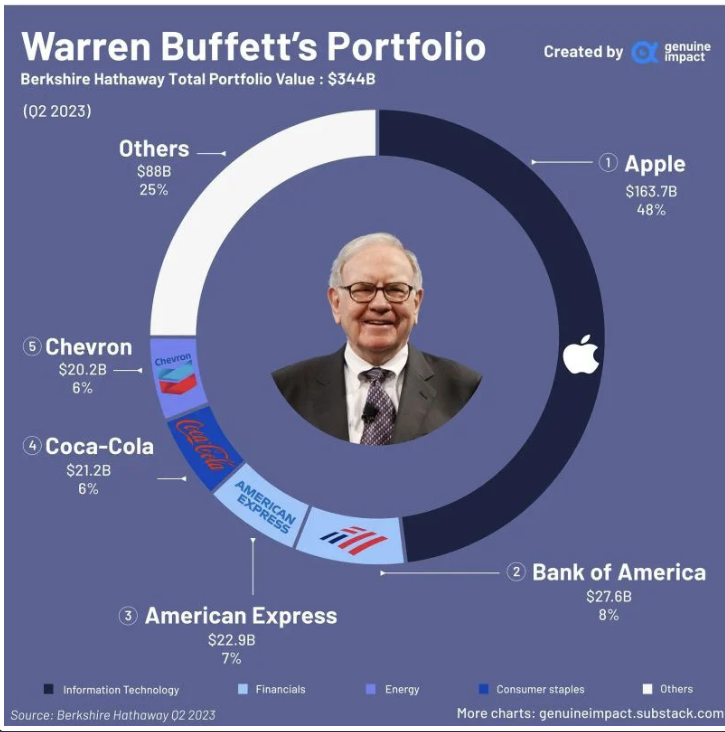
Almost half of Warren Buffett’s portfolio consists of Apple (48%), worth $163 billion. The top 5 stocks account for over 75% of the total portfolio.

Source: The week in seven charts, syz Group

Inflation Does Not Necessarily Affect Stock Returns

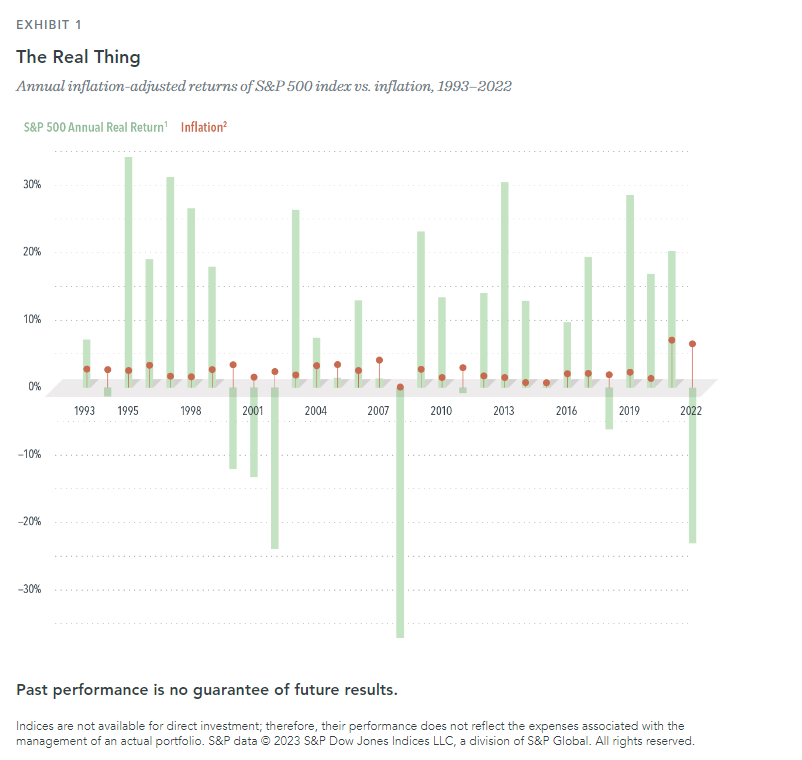
One of the factors that have been investors’ mind for the past many months has been inflation. Soaring inflation rates led the Federal Reserve to raise interest rates multiple times to tame inflation. Their effort might be bearing fruit soon. The recently release report from BLS showed inflation is cooling. The CPI rate was 3.2% in October compared to a year ago. Inflation rate has declined significantly from the 9% seen last summer. The latest news from BLS was a good news and investors bid up stocks last week based on the expectation that the Fed could stop increasing rates further.

According to an article at Dimensional Fund Advisors inflation is not always impact stock returns adversely. From the piece:

A look at equity performance in the past three decades does not show any reliable connection between periods of high (or low) inflation and US stock returns.

Since 1993, one-year returns on US stocks have fluctuated widely. Stock returns can be strong, or weak, or in between when inflation is high. For example, returns were relatively strong in 2021 but poor in 2022. Twenty-two of the past 30 years saw positive returns even after adjusting for the impact of inflation (see Exhibit 1).


FOOTNOTES
1Real returns illustrate the effect of inflation on an investment return and are calculated using the following method: [(1 + nominal return of index over time period) / (1 + inflation rate)] − 1. S&P data © 2023 S&P Dow Jones Indices LLC, a division of S&P Global. All rights reserved.

2Based on nonseasonally adjusted 12-month percentage change in Consumer Price Index for All Urban Consumers (CPI-U). Source: US Bureau of Labor Statistics.

Source: Will Inflation Hurt Stock Returns? Not Necessarily., Dimensional

For the period shown in the chart, stocks returned an average annualized return of 7.0% after adjusting for inflation. This is an excellent rate of return when considering other assets during high inflation times. Their research also shows the long-term average after inflation rate was 7.0% for stocks in the long run from 1926.

So the key takeaway is that equities are the best asset class regardless of inflation rates. Just because inflation rates are high investors shouldn’t sell out their stock holdings.

Related ETFs:

  1. SPDR S&P 500 ETF (SPY)
  2. iShares Core S&P 500 ETF (IVV)
  3. Vanguard S&P 500 ETF(VOO)
  4. SPDR Portfolio S&P 500 ETF (SPLG)

Disclosure: No positions