Industry Weightings in the US and UK Stock Markets in 1900 vs. 2021

In 1900, the US and UK equity markets looked a lot different than today. The US was an emerging market in the beginning of the 20th century while the UK was colonial super power. Now the UK is just another developed country but no longer a power. Unlike other emerging countries, the US economy grew dramatically in the past century or so and remains the dominant economy in the world.

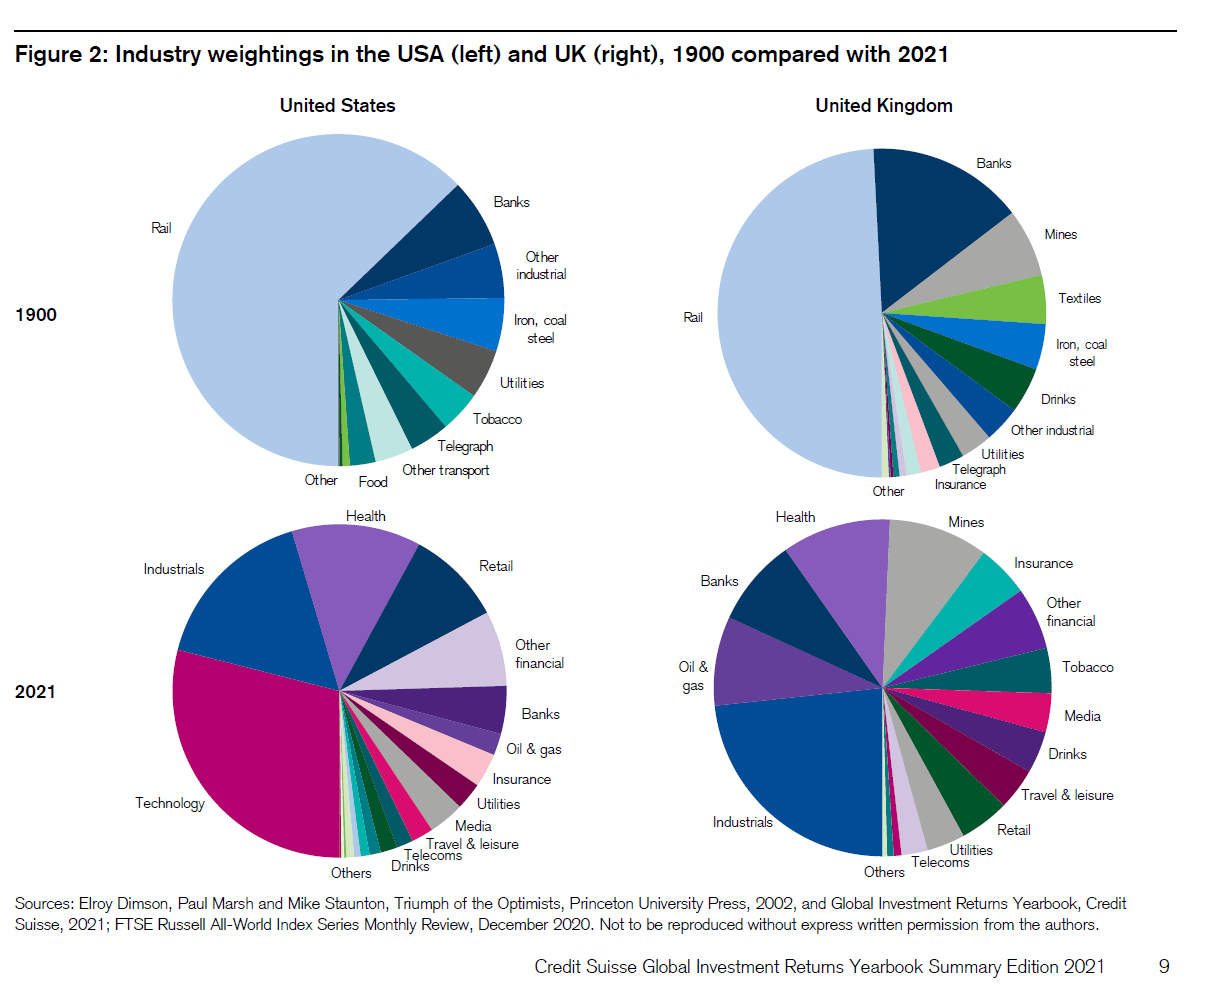
With that said, the recently published Credit Suisse Global Investment Returns Yearbook 2021 contains many fascinating facts. One chart that caught my attention is the below chart comparing the industry weightings of US and UK equity markets in 1900 and now:

Click to enlarge
Source: Credit Suisse Global Investment Returns Yearbook 2021, Credit Suisse

An excerpt from the report:

At the start of 1900 – the start date of our global returns database – virtually no one had driven a car, made a phone call, used an electric light, heard recorded music, or seen a movie; no one had flown in an aircraft, listened to the radio, watched TV, used a computer, sent an e-mail, or used a smartphone. There were no x-rays, body scans, DNA tests, or transplants, and no one had taken an antibiotic; as a result, many would die young.

Mankind has enjoyed a wave of transformative innovation dating from the Industrial Revolution, continuing through the Golden Age of Invention in the late 19th century, and extending into today’s information revolution. This has given rise to entire new industries: electricity and power generation, automobiles, aerospace, airlines, telecommunications, oil and gas, pharmaceuticals and biotechnology, computers, information technology, and media and entertainment.

Meanwhile, makers of horse-drawn carriages and wagons, canal boats, steam locomotives, candles, and matches have seen their industries decline. There have been profound changes in what is produced, how it is made, and the way in which people live and work.

A few observations:

  • At the start of 1900, railroads dominated the US and UK stock markets with a weightage of 63% and 50% respectively of market values.
  • Industries such as iron ore mining, steel, coal and textiles have declines since 1900 to become a small part of equity markets now.
  • Telegraph was the technology of the time back then. Now telegraph is extinct but we have smartphones and other hi-tech devices.
  • Despite many ups and downs, railroad stocks have beaten airline and trucking stocks in the past 121 years.
  • The railroad industry has become almost non-existent in the UK equity market.

Select related stocks:

  • Kansas City Southern (KSU)
  • CSX Corp (CSX)
  • Union Pacific(UNP)
  • Norfolk Southern Corp(NSC)
  • Schneider National, Inc.(SNDR)
  • J.B. Hunt Transport Services Inc. (JBHT)

Disclosure: Long CSX, UNP, NSC
Number of Years Needed for Vaccine Development and Approval: Chart

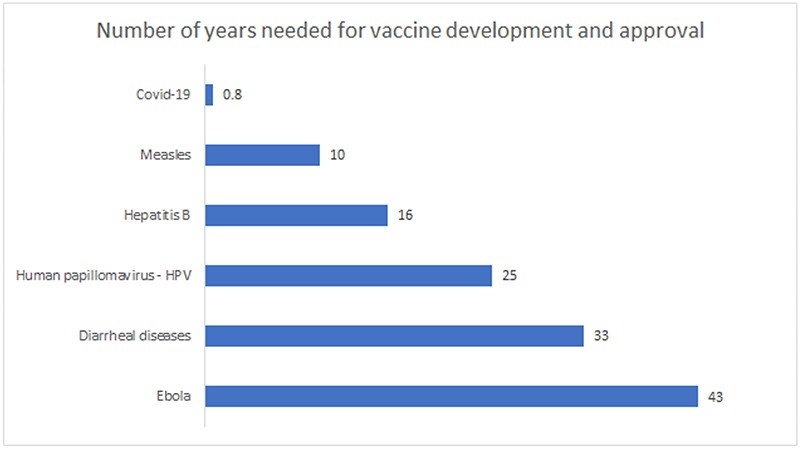
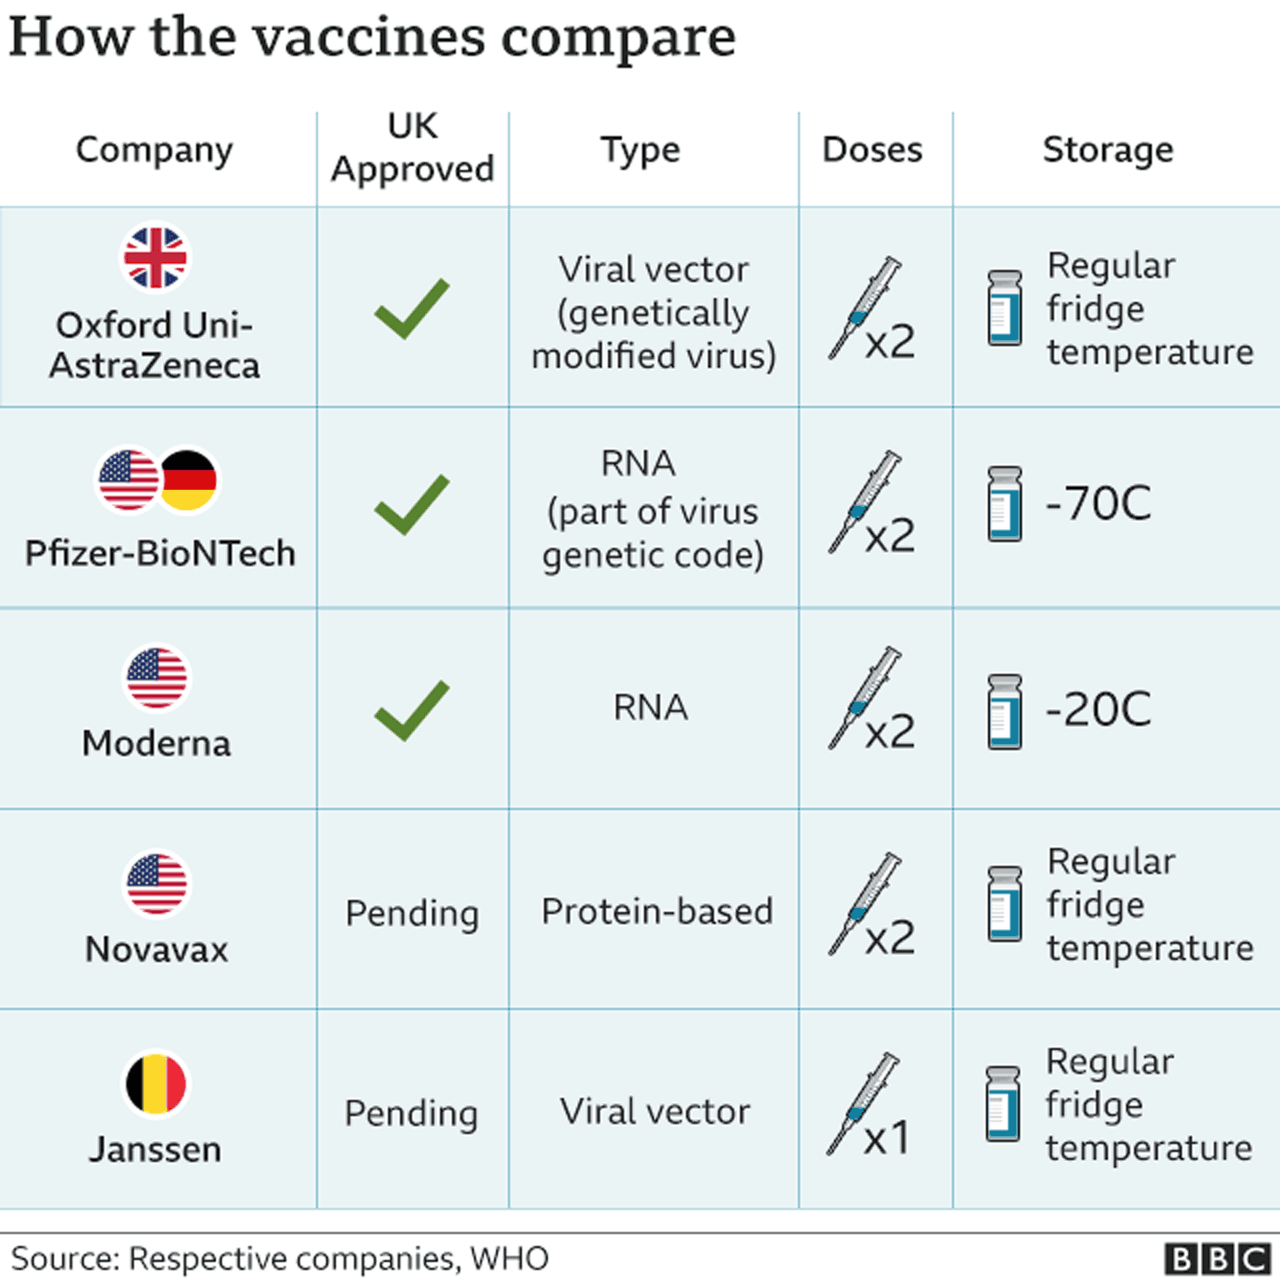
The process for development and eventual approval of vaccine usually takes years and years. However the vaccines for Covid-19 were developed and approved in surprisingly short amount of time. In less than a year, vaccines for the worst pandemic in modern history was ready for us. The very first vaccine was developed by  BioNTech SE (BNTX) and Pfizer(PFE) followed by Moderna (MRNA). UK’s AstraZeneca PLC(AZN) followed suit. Recently Johnson & Johnson (JNJ) came up with its own single shot vaccine. Many others are still in development stage.  The following chart shows a comparison of the vaccines:

Source: The BBC

Going back to our topic of discussion, the chart below shows number of years for development and approval of vaccines for other diseases:

Click to enlarge

Source: Graph of the week by Steef Bergakker, Robeco

Disclosure: No Positions

Retirement Ages by Country 2021: Chart

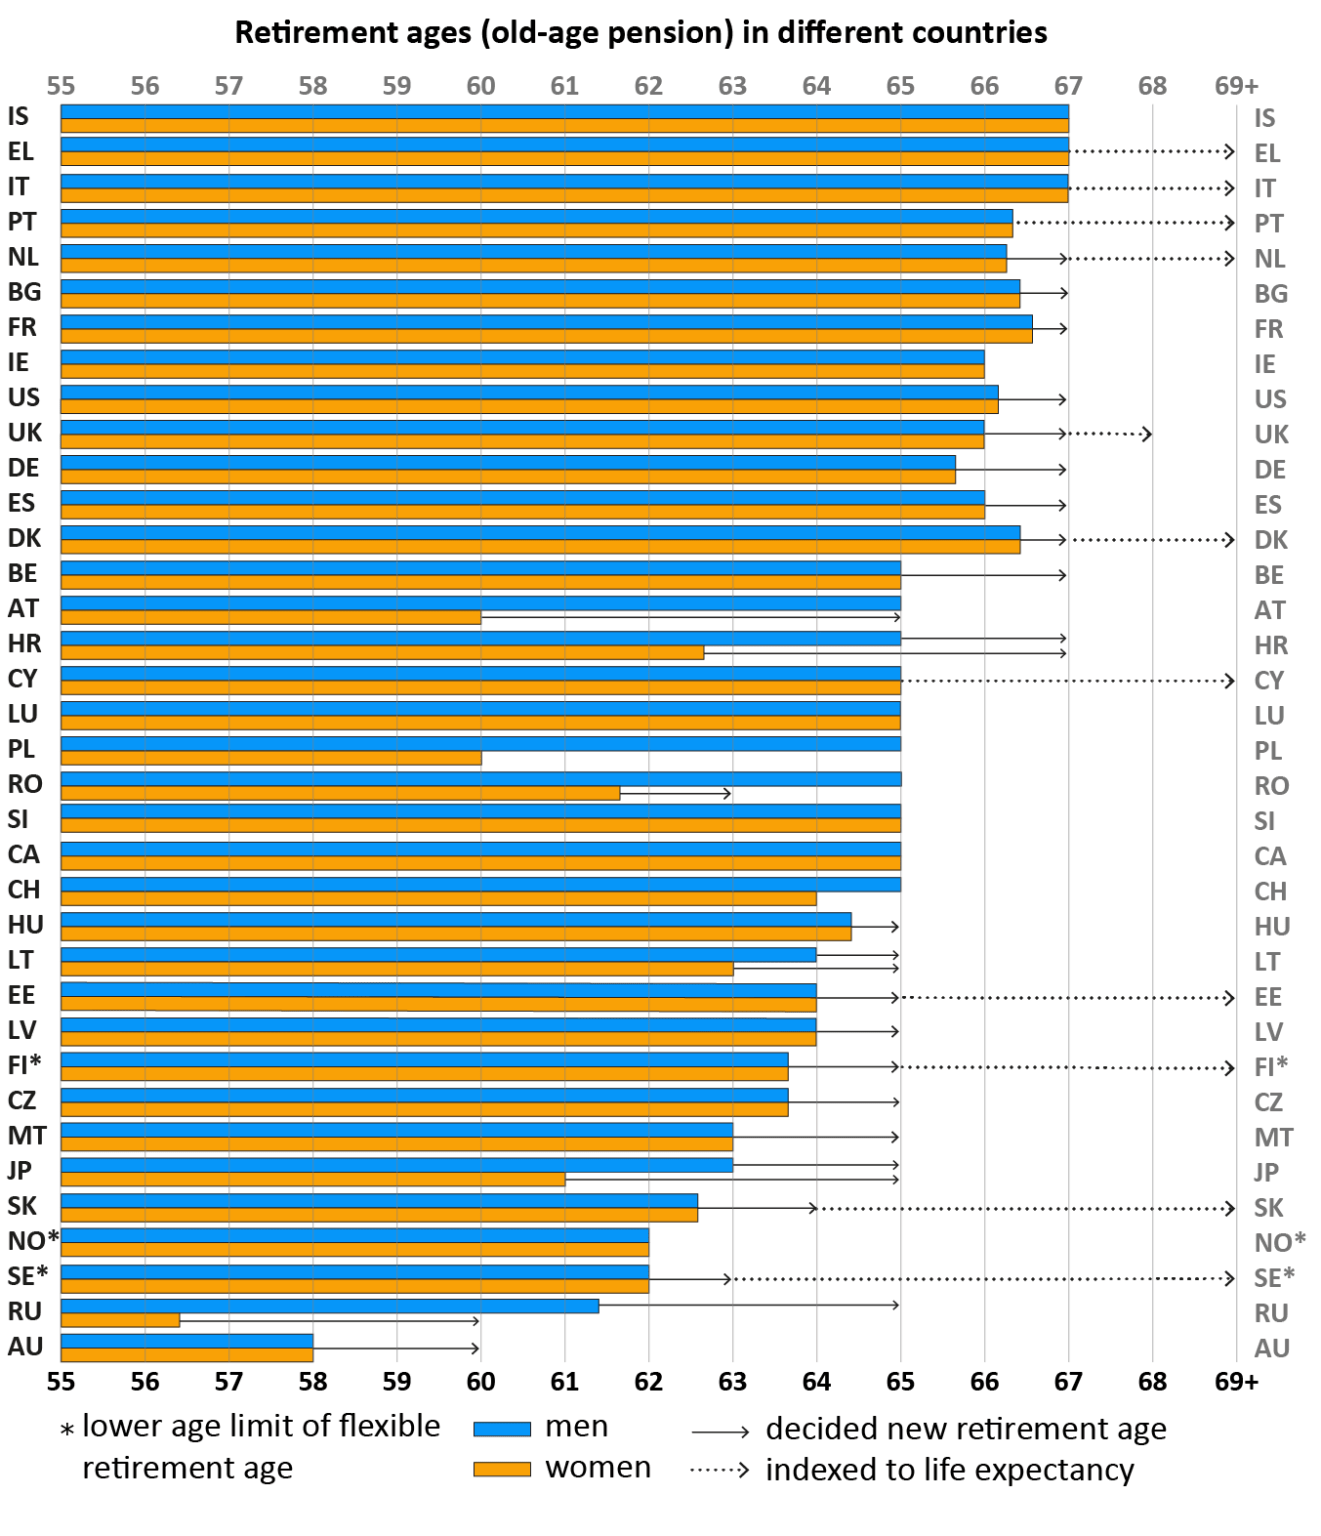
The Retirement Age varies between countries. The general retirement age in the European Union is 65. In Spain, France and Germany the retirement age is set to increase to 67 years from 65 according to an article at The Finnish Center for Pensions. Some countries have different retirement  ages for  men and women. For instance, in Switzerland the retirement ages for men and women are 65 and 64 respectively while in Russia, it is 61.5 years and 56.5 years respectively. In the US, both men and women have a retirement age of 66 years and 2 months.

The chart below shows the retirement age in select countries:

Click to enlarge

Source: Retirement Ages, The Finnish Center for Pensions

The Current Retirement Ages (2021):

Current general retirement age (2021)Future retirement age
EU Men/ WomenRetirement age or men/women
Austria (AT)65 / 60 years 65 years (2033)
Belgium (BE)65 years 67 years (2030)
Bulgaria (BG)66 years and 8 months 67 years (2023)
Croatia (HR)65 / 62 years 69 months 67 years (2033)
Cyprus (CY)65 years65+ years (2023)
Czech (CZ)63 years and 10 months65 years (2036)
Denmark (DK)67 years; 66 years 6 months*67 years (2022); 68+ years (2030)
Estonia (EE)64 years65 years (2026)
68+ (2027)
Finland (FI)63 years 9 months – 68 years; 65 years*65+ years (2027); 65+ (2030)
 France (FR)66 years and 7 months 67 years  (2023)
Germany (DE)65 years and 9 months 67 (2031)
Great Britain (GBR)66 years68 (2046)
Greece (EL)67 years67+ years (2021)
Hungary (HU)65 years–
Ireland (IE)66 years68 years (2028)
Italy (IT)67 years67+ years (2022)
Latvia (LV)64 years 65 years (2025)
Lithuania (LT)64 years 2 months / 63 years 4 months 65 years (2026)
Luxembourg (LU) 65 years –
Malta (MT) 63 years 65 years (2027)
Netherlands (NL) 66 years 4 months 67+ years (2025)
Poland (PL) 65 years / 60 years –
Portugal (PT) 66 years and 6 months 66+ years (2016)
Romania (RO) 65 years / 61 years 6 –9 months -/63 years (2030)
Slovakia (SK) 62 years and 8–10 months 64 years (2030)
Slovenia (SI) 65 years –
Spain (ES) 66 years 67 years (2027)
Sweden (SE)62-68 years; 65 years*63-69 (2023),  63+ (2026); 66 (2023), 66+ (2026)
Other countries Men / Women Retirement age or men/women
Australia 58 years; 66 years 6 months*60 years (2024); 67 years (2023)*
Canada (CA) 65 years –
Iceland (IS) 67  years
Japan (JP)63 years / 61 years; 65*65 years (2025) / 65 years (2030); –
Norway (NO)62–75 years; 67 years* –
Russia (RU)61 years and 6 months / 56 years and 6 months65 years (2028); 60 (2028)
Switzerland (CH) 65 years / 64 years –
USA (US) 66 years 2 months 67 years (2027)
* FI, SE, DK, NO, AU and JP: the retirement age of the earnings-related pension has been separated from that of the national pension with a semicolon. GP= Government proposal or plan of equivalent administrative level+ = Retirement age rising along with the increasing life expectancy.

Note: The table lists first the earnings-related retirement age, then the national retirement age if it deviates from the first. Men’s and women’s retirement ages are also listed,  if they differ from each other.

Update (11/17/23):

Latest version:

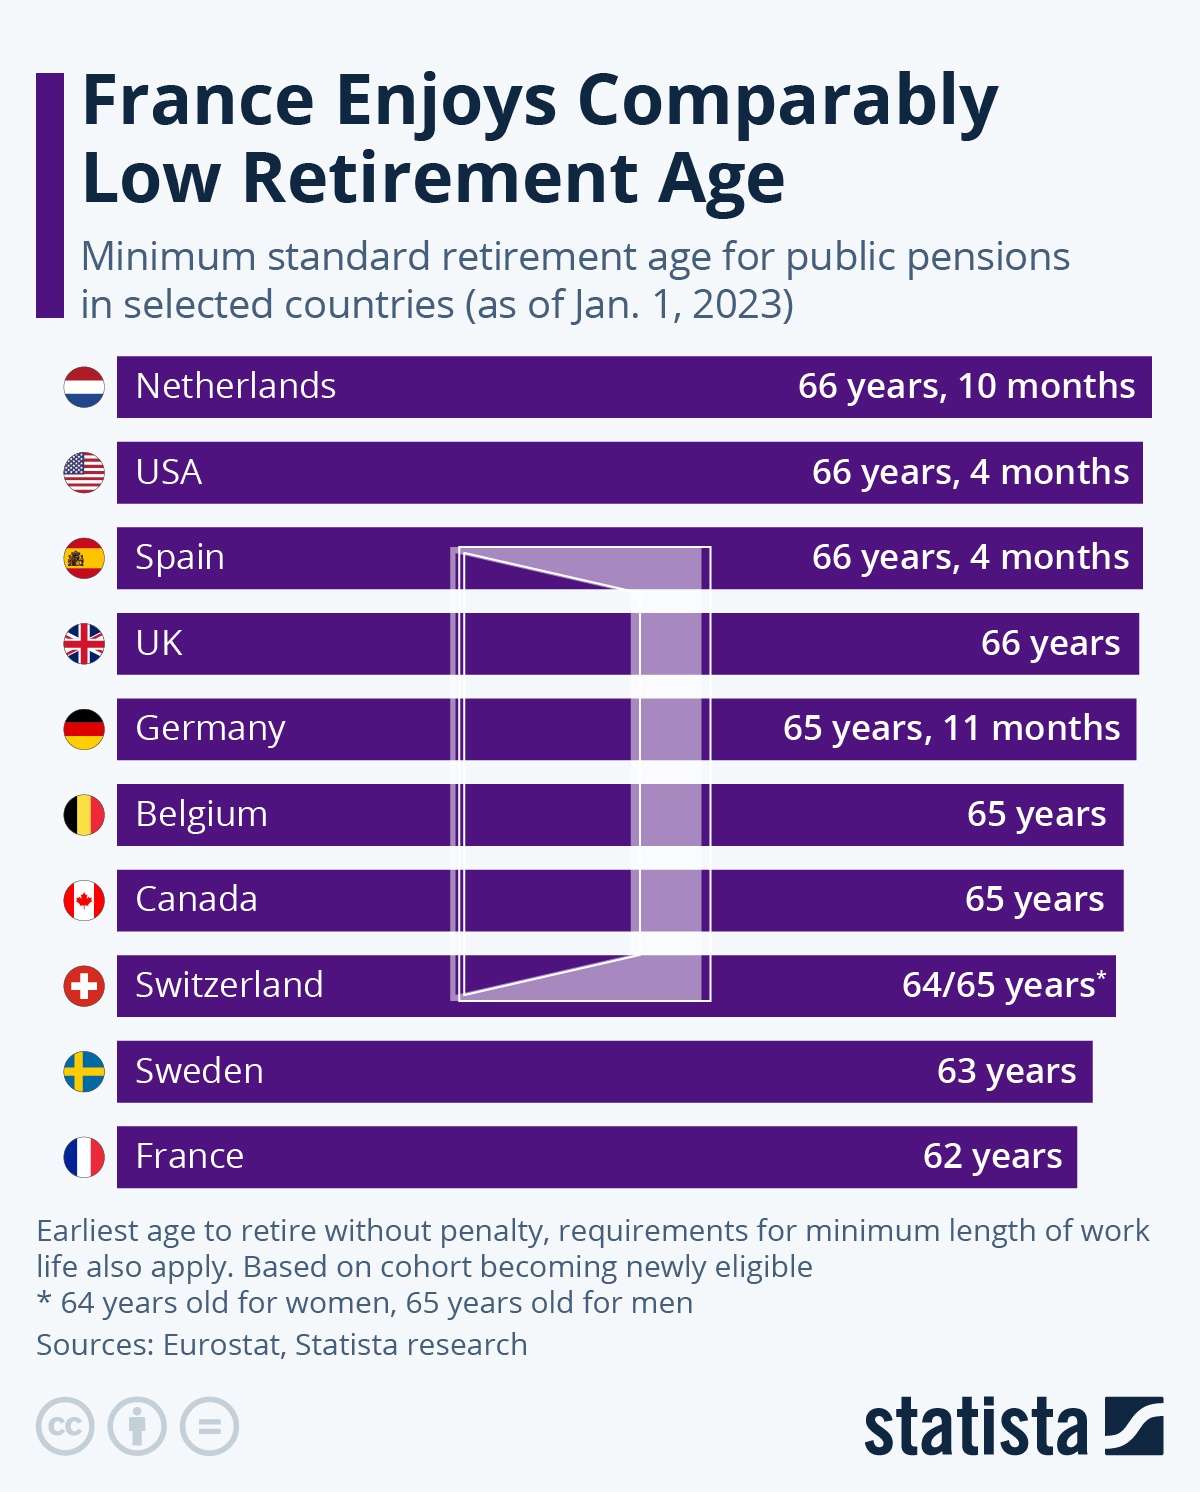
1.Minimum Standard Retirement Age for Select Countries as of Jan 2023:

Click to enlarge

Source: France Enjoys Comparably Low Retirement Age, Statista

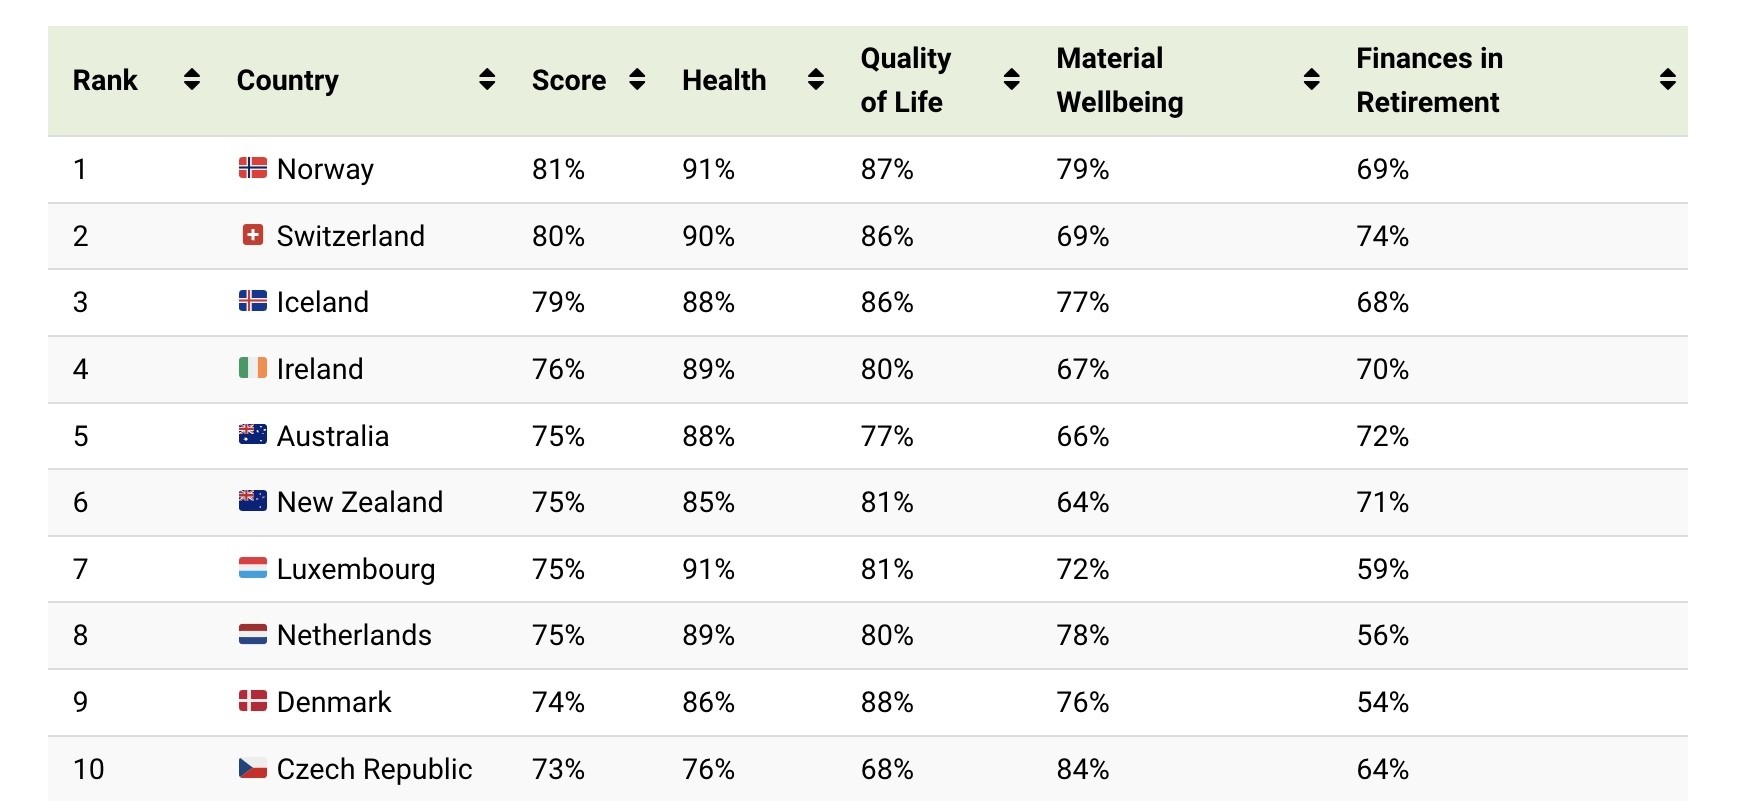
2. Ranked: The Best Countries to Retire in Around the World

Click to enlarge

Source: WEF

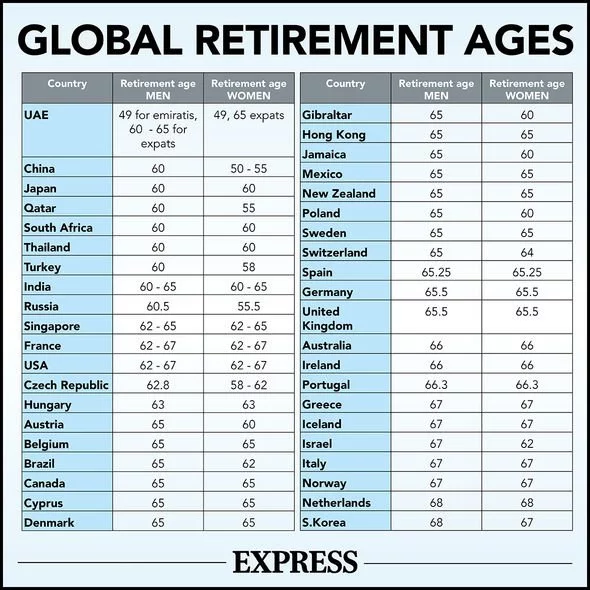
3.Global Retirement Ages:

Click to enlarge

Source: How UK state pension age compares to retirement ages in other countries around the world, Express

Related Posts:

Asset Class Returns Quilt From 2006 To 2020: Chart

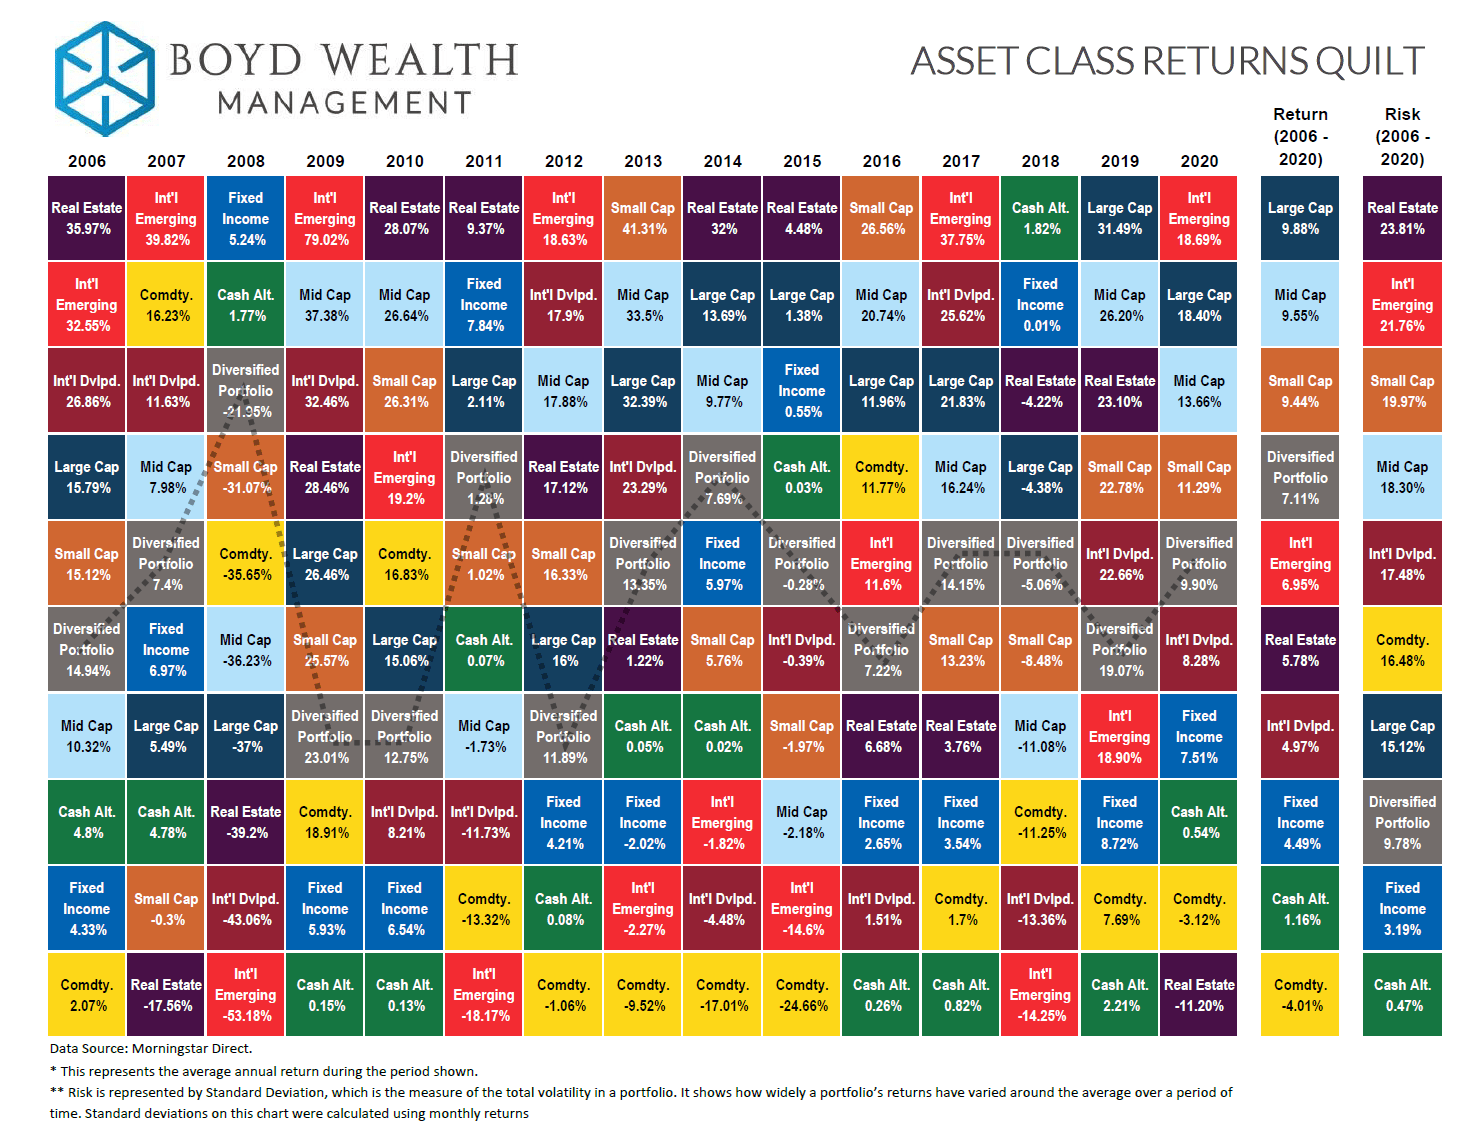
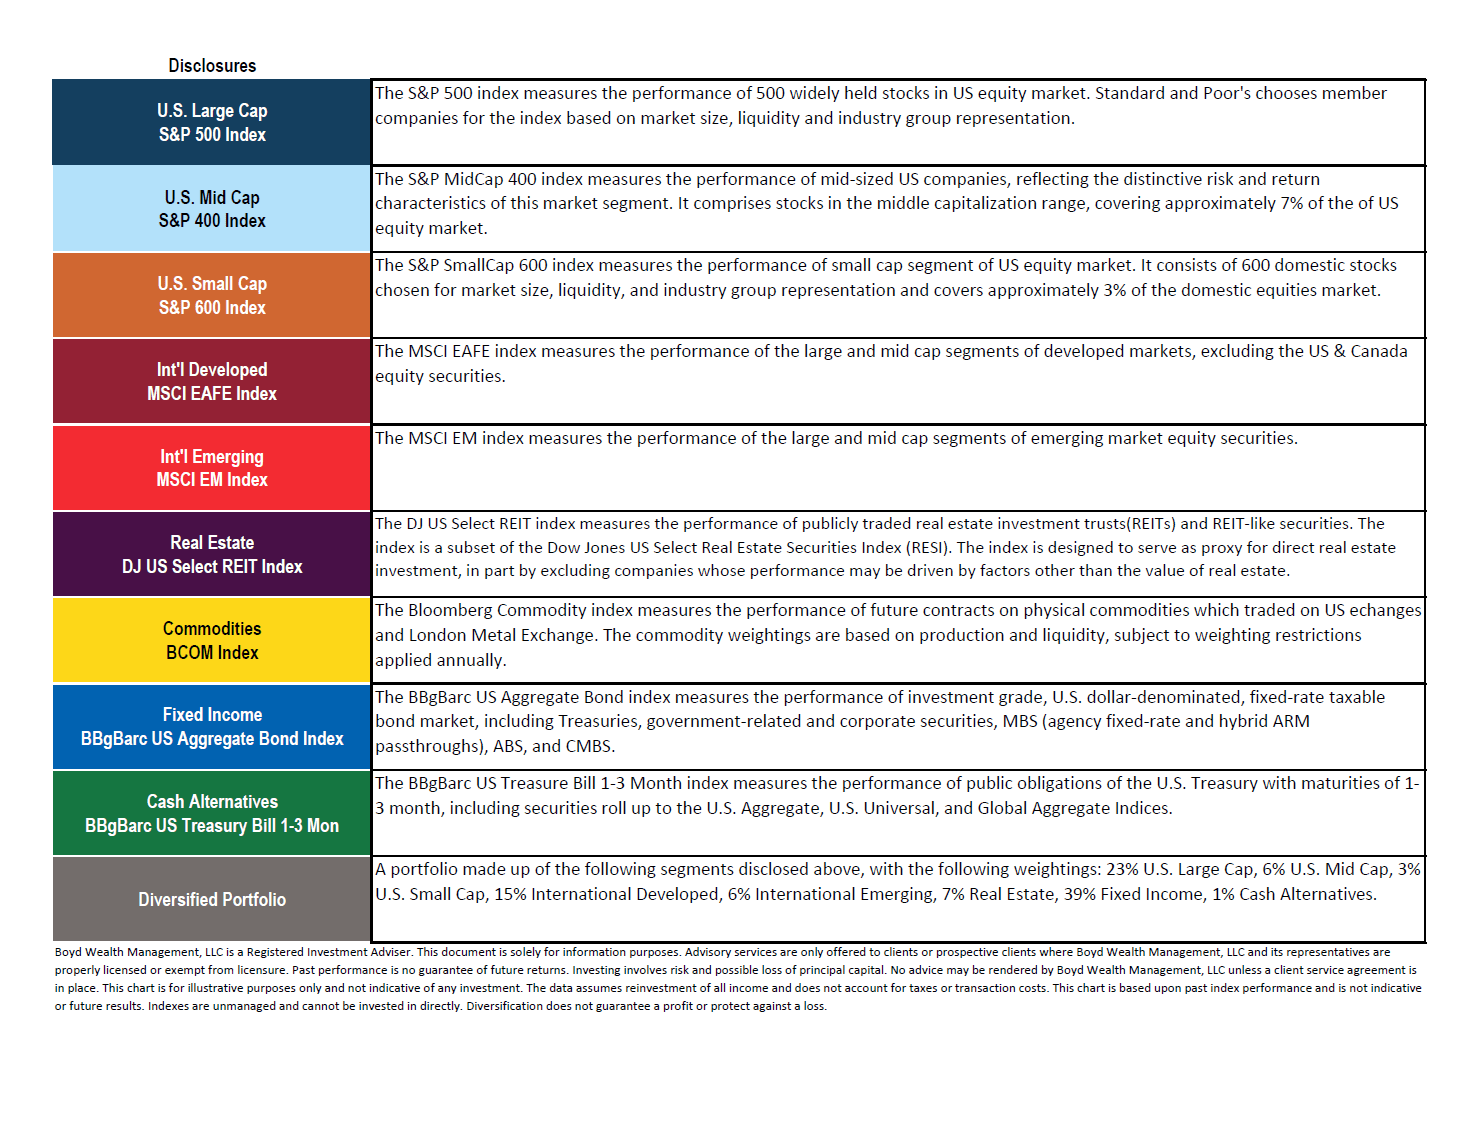
Following our theme of reviewing asset class returns over the years and the importance of diversification, the following is another chart showing the annual returns and average returns from 2006 to 2020. Commodities have never been the best performer since 2006. Similarly the best return for emerging equities was all the way back in 2009 when it topped over 79%. Since the Global Financial Crisis of 2008-09 emerging markets were mostly average or poor performers.

Click to enlarge


Note: The returns shown above are price returns (i.e. excluding dividends)

Source: Boyd Wealth Management

Market Leadership Changes From 2001 To 2020: Chart

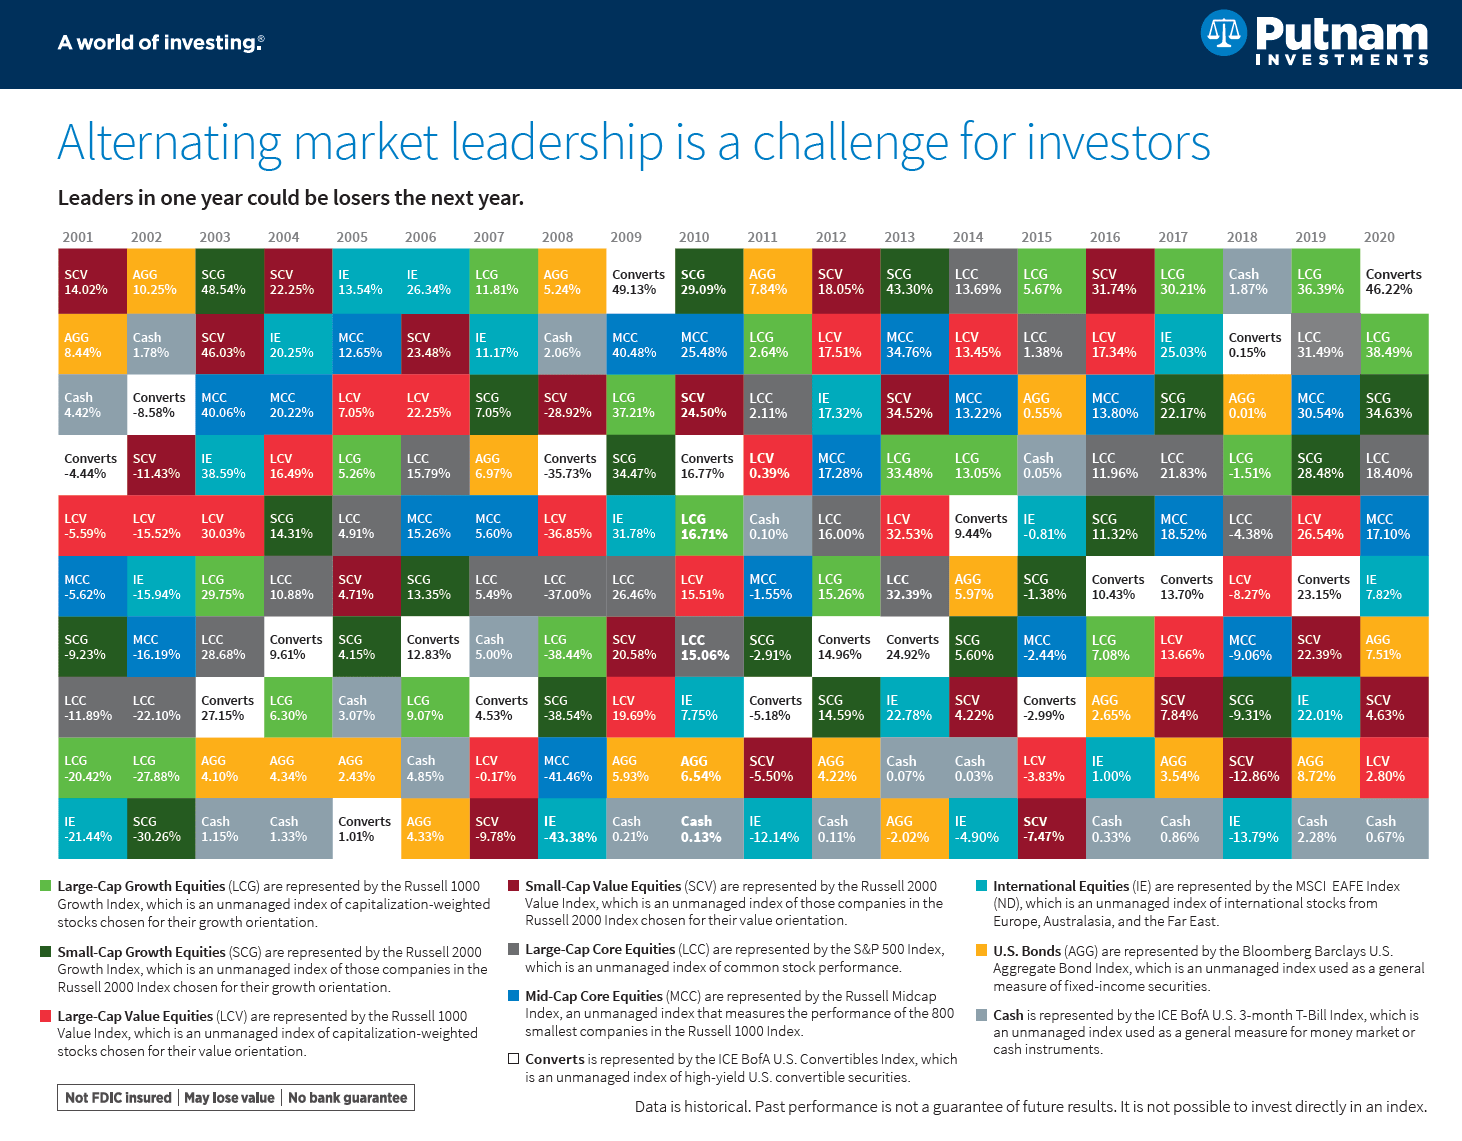
One of the key factors for success with investing in equities is to distribute one’s assets across many asset classes, sectors and regions. Diversification is the simplest and cheapest way to reduce risk for retail investors. Today’s winners in the market can become tomorrow’s losers. Or to put it another way, a winner in one year may not necessarily be the winner the following year. Market leadership changes year after year. For example, large cap growth stocks were the top performers in 2007 but crashed heavily during the global financial crisis of 2008. The following chart vividly shows the alternating market leadership from 2001 through 2020:

Click to enlarge

Source: Putnam Investments

Related ETFs:

  • SPDR S&P 500 ETF (SPY)
  • S&P MidCap 400 SPDR ETF (MDY)
  • SPDR Consumer Discretionary Select Sector SPDR Fund (XLY)
  • SPDR Consumer Staples Select Sector SPDR Fund (XLP)
  • SPDR Energy Select Sector SPDR Fund (XLE)
  • SPDR Financials Select Sector SPDR Fund (XLF)
  • iShares Dow Jones Select Dividend ETF (DVY)
  • SPDR S&P Dividend ETF (SDY)
  • Vanguard Dividend Appreciation ETF (VIG)
  • Vanguard MSCI Emerging Markets ETF (VWO)
  • Vanguard Developed Markets Index Fund ETF (VEA)
  • iShares MSCI Emerging Markets ETF (EEM)

Disclosure: No Positions