Why Invest in Countries Based on Their Industry Exposure

Investing in foreign stocks involves a thorough analysis of many factors such as market type (emerging vs. developed vs. frontier markets), form of government, liquidity, transparency, accounting standards, etc. After deciding on a particular country, it is again important to determine in what industries or sectors to invest in. This decision is critical because each countries excels in one or more industries. To put it another way, one country’s strength may be in industrial production while another may be a leader in commodities. So for example, if an investor decides to invest in a natural resources-rich country such as Brazil or Australia it is wise to pick stocks in the commodity industry. It would not make sense to look for EV industry or semiconductor plays in these countries. Instead going with an agricultural producer in Brazil or an iron-ore miner in Australia is a sound strategy.

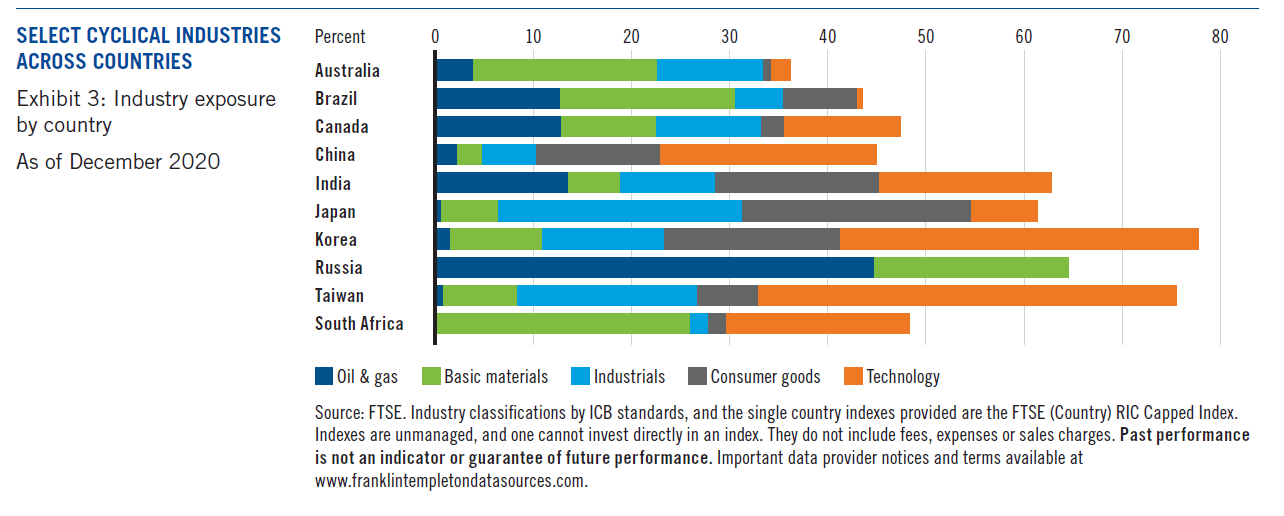
With that said, the below chart shows the industry exposure by country. As commodity prices have surged this year, countries with high exposure in this sector would benefit from further increases as the global economic recovery gains momentum this year.

Click to enlarge
Source: Single-Country Allocation: Viewing the Opportunity Through Three Lenses, Franklin Templeton

Russia is a top oil & gas producer while Taiwan and South Korea are heavy weights in the technology sector. So investment picks in these countries should mirror this logic. Searching for tech leaders in Russia is not the best idea. On the other hand picking up stocks in Russian oil & gas producers has better potential for high returns.

Listed below are a few stocks from some of the above countries:

  • Russia – Gazprom(OGZPY), LUKOIL (LUKOY), Rosneft Oil Company (OJSCY) and Surgutneftegas (SGTPY)
  • Brazil – Petrobras SA (PBR) and Ultrapar Participacoes SA (UGP)
  • Taiwan – Taiwan Semiconductor Manufacturing Co Ltd (TSM), United Microelectronics (UMC) and AU Optronics (AUO)
  • Australia – BHP Billiton (BHP) and Piedmont Lithium (PLL)
  • South Africa –  AngloGold Ashanti  (AU) and Harmony Gold (HMY)

Disclosure: Long PBR
Sources of Government Revenue Vary Widely Across OECD Countries: Chart

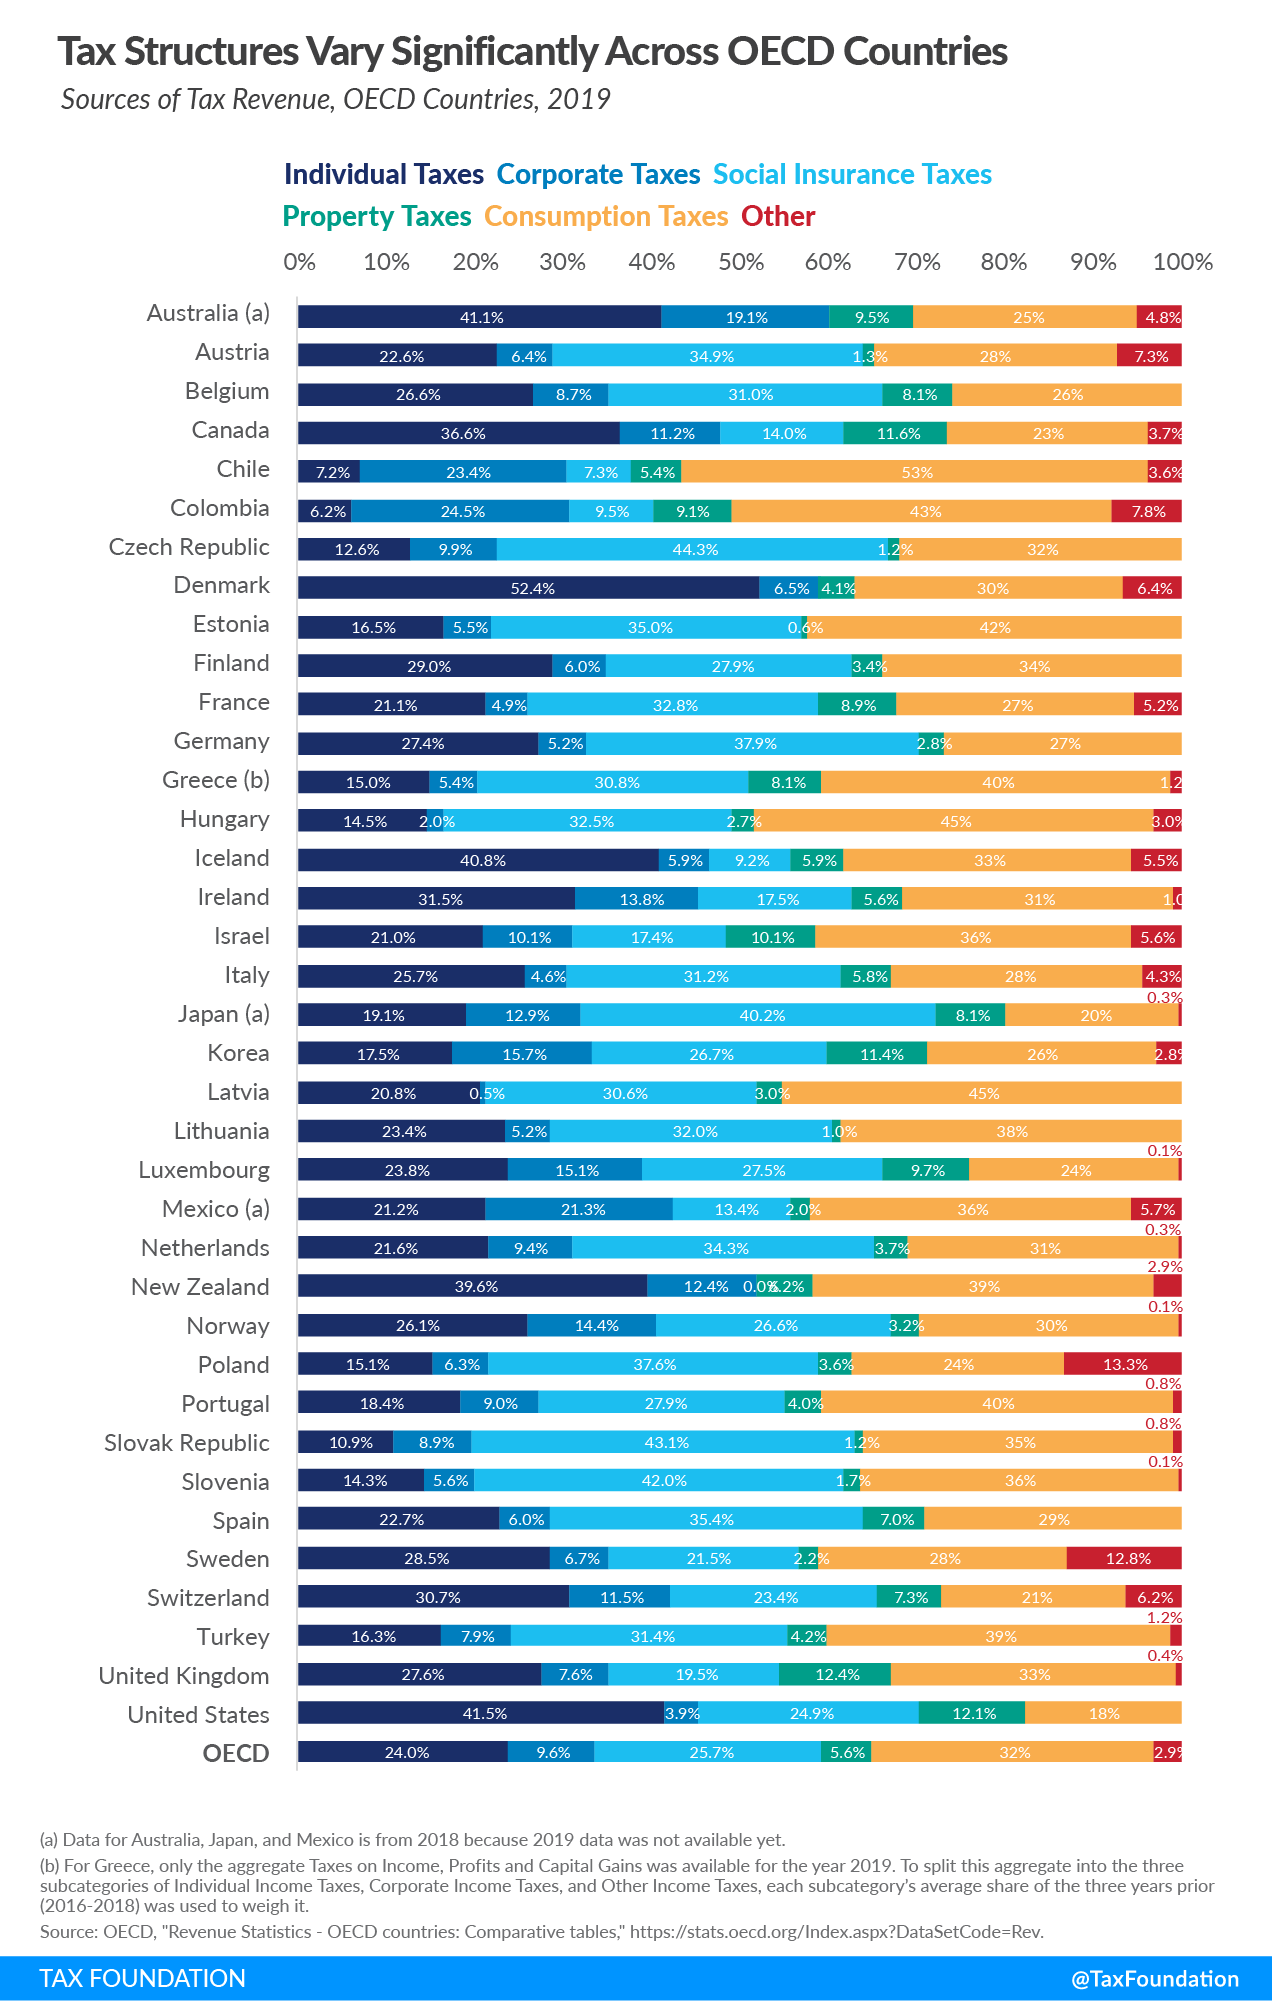
Governments in the OECD countries collect tax revenues that can be grouped into the following categories: Consumption Taxes, Social Insurance Taxes, Individual Taxes, Corporate Taxes, Property Taxes and Other. On an average, Consumption Taxes such as Value-Added Tax (VAT) accounted for one-third of tax revenues in OECD member countries in 2019 according to an article by Cristina Enache at The Tax Foundation.

The second and third most revenues came from Social Insurance Taxes and Individual Income Taxes. In terms of Corporate Taxes, on average just 9.6% of revenues were accounted from Corporate Taxes collected.

In the US, corporations are considered as human beings by law. They are living, breathing human beings that can do almost everything a human does like marry another corporation, fight for rights, lobby for favorable rules and regulations, contribute to political campaigns, etc. However when it comes to paying real humans pay the most taxes in the country as opposed to corporations, which are also humans in a technical sense. Americans contributed 41.5% of federal government revenue in the form of individual taxes. Corporations on the other hand paid 3.9% of the revenue. Or to put it another way, individuals paid more than ten times in taxes than corporations. The OECD average corporate tax rate is 9.6%. Some of the countries that earned high revenues from corporate taxes were: Australia, Chile, Colombia and Mexico.

The following chart shows the various sources of revenue for OECD countries:

Click to enlarge

Source: Sources of Government Revenue in the OECD by Cristina Enache, The Tax Foundation

Why International Diversification is Important

Diversification is a simple and easy way to reduce risk. While spreading one’s funds across various asset classes is wise it is also important to avoid investing all or most the funds in one’s home country companies. Most investors including those in the US  are affected by what’s called the “Home Bias”. According to a Vanguard study, just over 80% of American investors’ portfolios are invested in US companies. Recently I came across an interesting article on the importance of diversification. Below is an excerpt from the piece:

It Might be Time to Take a Fresh Look at Your Portfolio

Given the incredible run in the U.S. stock market over the past 12 years, now may be just the time to consider how diversified your portfolio truly is. Taking a fresh look at international developed and emerging markets may be just what your portfolio needs.

Recent Performance Advantage of the U.S. Stock Market

Some may point to the performance advantage the U.S. stock market has experienced over the past several years as justification for this bias. And it is true that U.S. companies have outperformed more recently. In fact, the U.S. market outperformed an index of international developed markets 9 out of 10 years from 2011 to 2020; however, during the 10 years prior (2001 to 2010), the U.S. outperformed in only 3 years. And if we take a long-run view over the past 50 years, the U.S. has outperformed exactly half of the time. Thus, from a performance perspective, history suggests a need for global diversification as well. But this performance argument is potentially flawed regardless. Again, diversification is more about ensuring you have an optimal investment portfolio. By not taking advantage of international diversification, investors are not optimally controlling for the risk within their portfolios.

The U.S. Stock Market has become Top-Heavy

A more recent trend in U.S. markets may highlight further need for international diversification. Due to the outsized performance of the “FAANG” stocks (Facebook, Apple, Amazon, Netflix, and Google) in recent years, the U.S. stock market is historically top-heavy. This suggests that an investment portfolio dominated by U.S. stocks will be overly sensitive to a handful of large U.S. technology companies. A globally diverse portfolio can provide the necessary diversification to ease this sensitivity.

SourceJust How Diversified is your Portfolio?, Scottsdale Wealth Planning

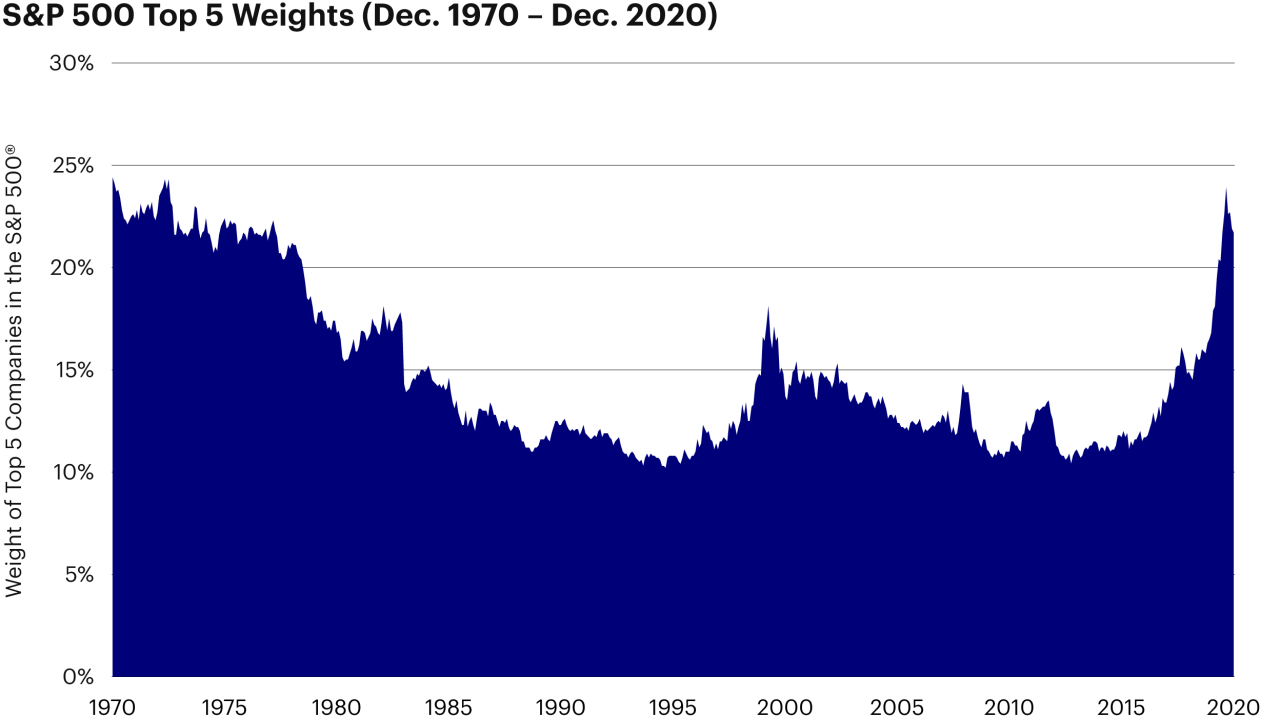
Indeed the S&P 500 is heavily concentrated as shown in the following chart:

Source: Take the concentration out of the S&P 500 with RSP, Invesco

From the above article:

As a market capitalization-weighted index, the S&P 500 typically has a heavy concentration in a few names, and as its top five holdings  as of Dec. 14, 2020 — Microsoft (MSFT), Apple (AAPL), Amazon (AMZN), Alphabet (GOOG/GOOGL), and Facebook (FB) —have zoomed ever higher in 2020, they have come to dominate the Index’s performance. While the S&P 500 ostensibly measures 500 companies, the five largest companies have grown to account for nearly 22.0%3 of its weighting, a significant rise from 16.8% at the end of 2019.

Note: As the S&P 500 has grown ever more top-heavy, many investors in products tied to the Index have found themselves facing historic levels of concentration risk, the likes of which passive investors have not seen since 1970 — half a century ago3

Related ETF:

  • SPDR S&P 500 ETF Trust (SPY)

Disclosure: No Positions

Five Latin American Stocks To Consider

Latin American equity markets offer some of the best emerging market equity opportunities after Emerging Asian markets. Economies in the region are mainly driven by natural resources or agricultural commodities. With a thriving middle class and relatively closer proximity to North America, investors can find plenty of unique companies. For instance, one of the sectors to consider is the the banking sector. Another is the oil industry that offers relatively attractive stocks. Though many Latin countries were severely impacted by Covid-19 and some are still struggling contain the virus, from the vaccination standpoint Chile is leading the continent. According to NY Times data, Chile is the fourth most vaccinated country in the world after the U.K. 26% of the population has been vaccinated with at least one dose. Brazil’s healthcare system is under immense pressure due to soaring Covid cases and deaths but it should eventually subside just like in so many other countries including the US.

From an investment perspective, Chile and Mexico equities are already performing very well so far this year. Chile’s IPSA index is up over 17% and Mexico’s IPC has increased by 8%. Mexico has benefitted from reopening of the manufacturing and potential growth of the tourism sectors. Soaring copper prices have led to the Chilean economy’s strong growth.

With that brief overview, the following are five Latin American stocks investors can consider for further research and analysis:

1.Company: Bancolombia SA . (CIB)
Current Dividend Yield: 4.42%
Sector: Banking
Country: Colombia

2.Company: Ecopetrol SA(EC)
Current Dividend Yield: 6.74%
Sector: Oil
Country: Colombia

Ecopetrol has grown by only 2.8% year-to-date. The firm has put forth its proposal for the dividend distribution in the Annual Shareholder Meeting to be held on March 26th.

3.Company: Petrobras (PBR)
Current Dividend Yield: 3.32%
Sector: Oil
Country: Brazil

PBR declined heavily recently after President Bolsonaro replaced the market-friendly CEO with a military general with industry experience. Despite the political risk, PBR is attractive relative to other major oil firms since the stock has crashed while global crude oil prices have jumped by over 50%.

4.Company: Azul (AZUL)
Current Dividend Yield: No Dividend paid
Sector: Airline
Country: Brazil

5.Company: Credicorp Ltd (BAP)
Current Dividend Yield: 3.97%
Sector: Banking
Country: Peru

Notes:

1.Dividend yields noted above are as of Mar 12, 2021. Data is known to be accurate from sources used. Please use your own due diligence before making any investment decisions.

2.Dividend Withholding Taxes will reduce dividend yields shown above.

3.In addition, ADR fees may also apply.

Disclosure: Long EC, PBR

The 2021 Top 20 US Banks

The S&P 500 is up around 5% year-to-date. But the benchmark index for the US banking sector, KBW Bank Index has shot up nearly 24% already this year. Bank stocks are hot again after many months of average performance. With the latest stimulus and the upcoming recovery in economy banks are in a sweet spot.

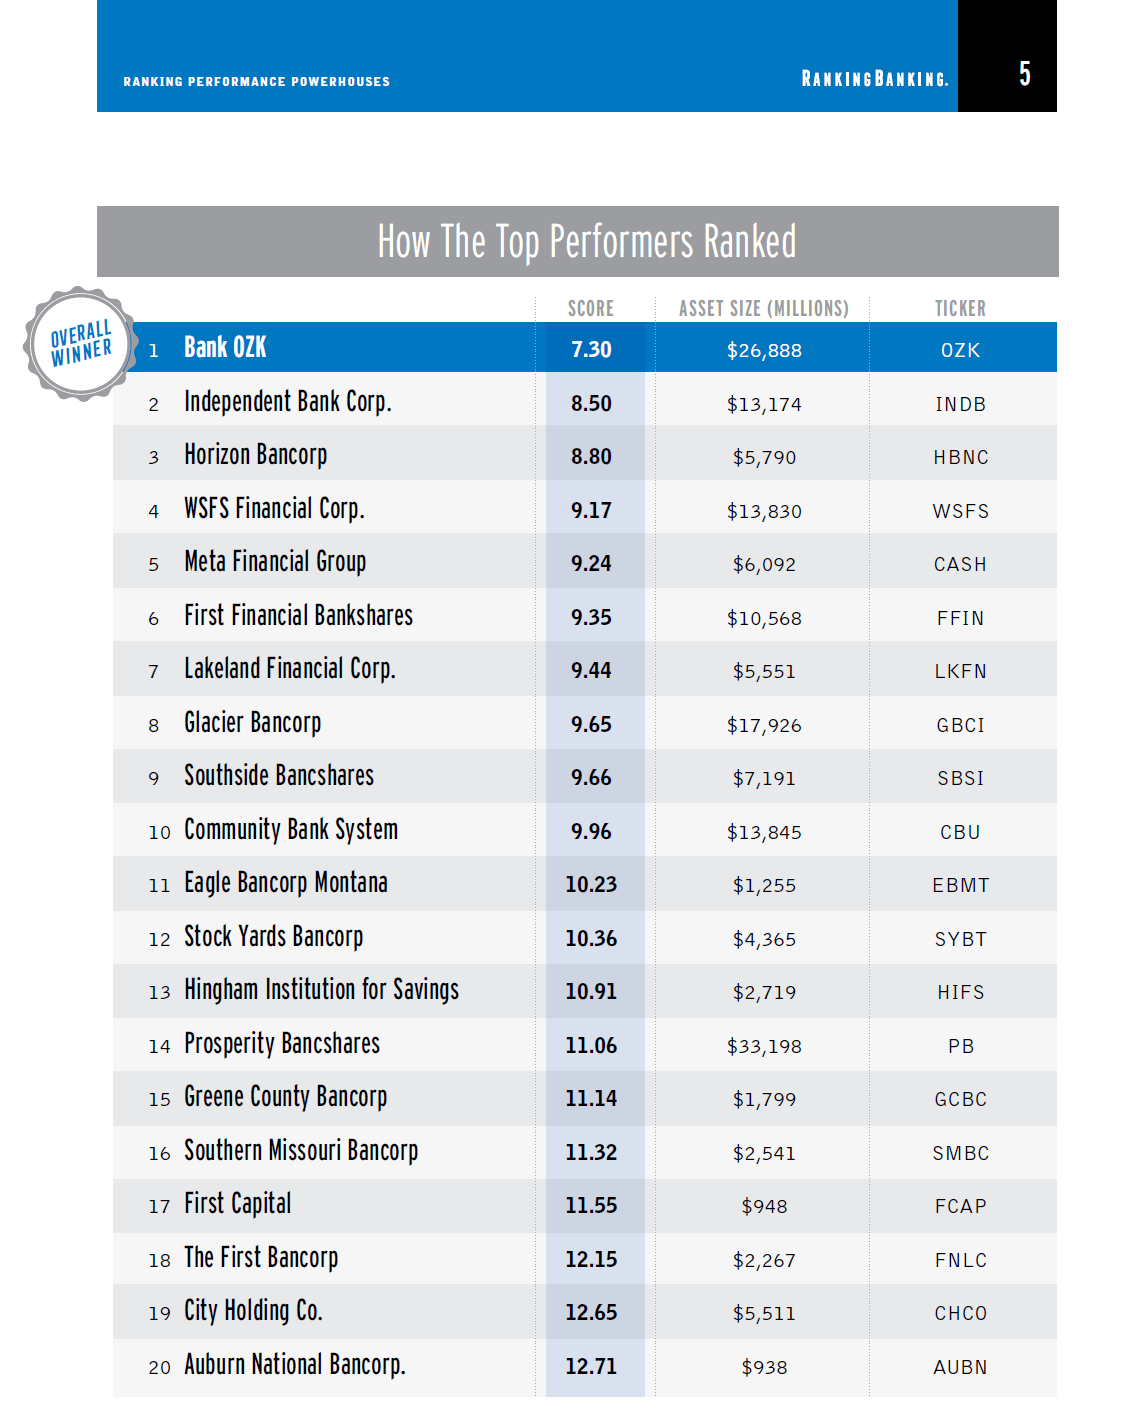
With that said, each year Bank Director magazine analyzes banks in the country and publishes a report ranking the best banks. The 2021 ranking of the 20 Top Performing Banks are shown in the table below:


Click to enlarge

Source: 2021 Ranking Banking: Performance Powerhouses, Bank Director

The ranking listed the best banks in a many categories such as retail strategy, revenue strategy, etc. The above list shows the overall best performers. These banks were shown based on the following criteria:

For each category, Bank Director sourced quantitative data from S&P Global Market Intelligence, company filings and other publicly available information. All told, more than 150 data points factored into our analysis, with the data spanning a five-year time period, from December 2014 to December 2019 — a date selected to avoid the muddiness of the pandemic environment. We also built case studies to better understand each bank’s performance, from its reputation as an employer to its technology strategy.

An algorithm was developed for each category; data points were ranked, with the lower score indicating the better performance. We then averaged the category scores to determine the overall winner. Total shareholder return was only used to identify the top 20 performance powerhouses and didn’t factor further into the ranking.

For investors looking to gain exposure to the sector, the above list offers a good starting point. The complete report is also worth a read.

Disclosure: Long GBCI