One of the key factors for success with investing in equities is to distribute one’s assets across many asset classes, sectors and regions. Diversification is the simplest and cheapest way to reduce risk for retail investors. Today’s winners in the market can become tomorrow’s losers. Or to put it another way, a winner in one year may not necessarily be the winner the following year. Market leadership changes year after year. For example, large cap growth stocks were the top performers in 2007 but crashed heavily during the global financial crisis of 2008. The following chart vividly shows the alternating market leadership from 2001 through 2020:
Click to enlarge
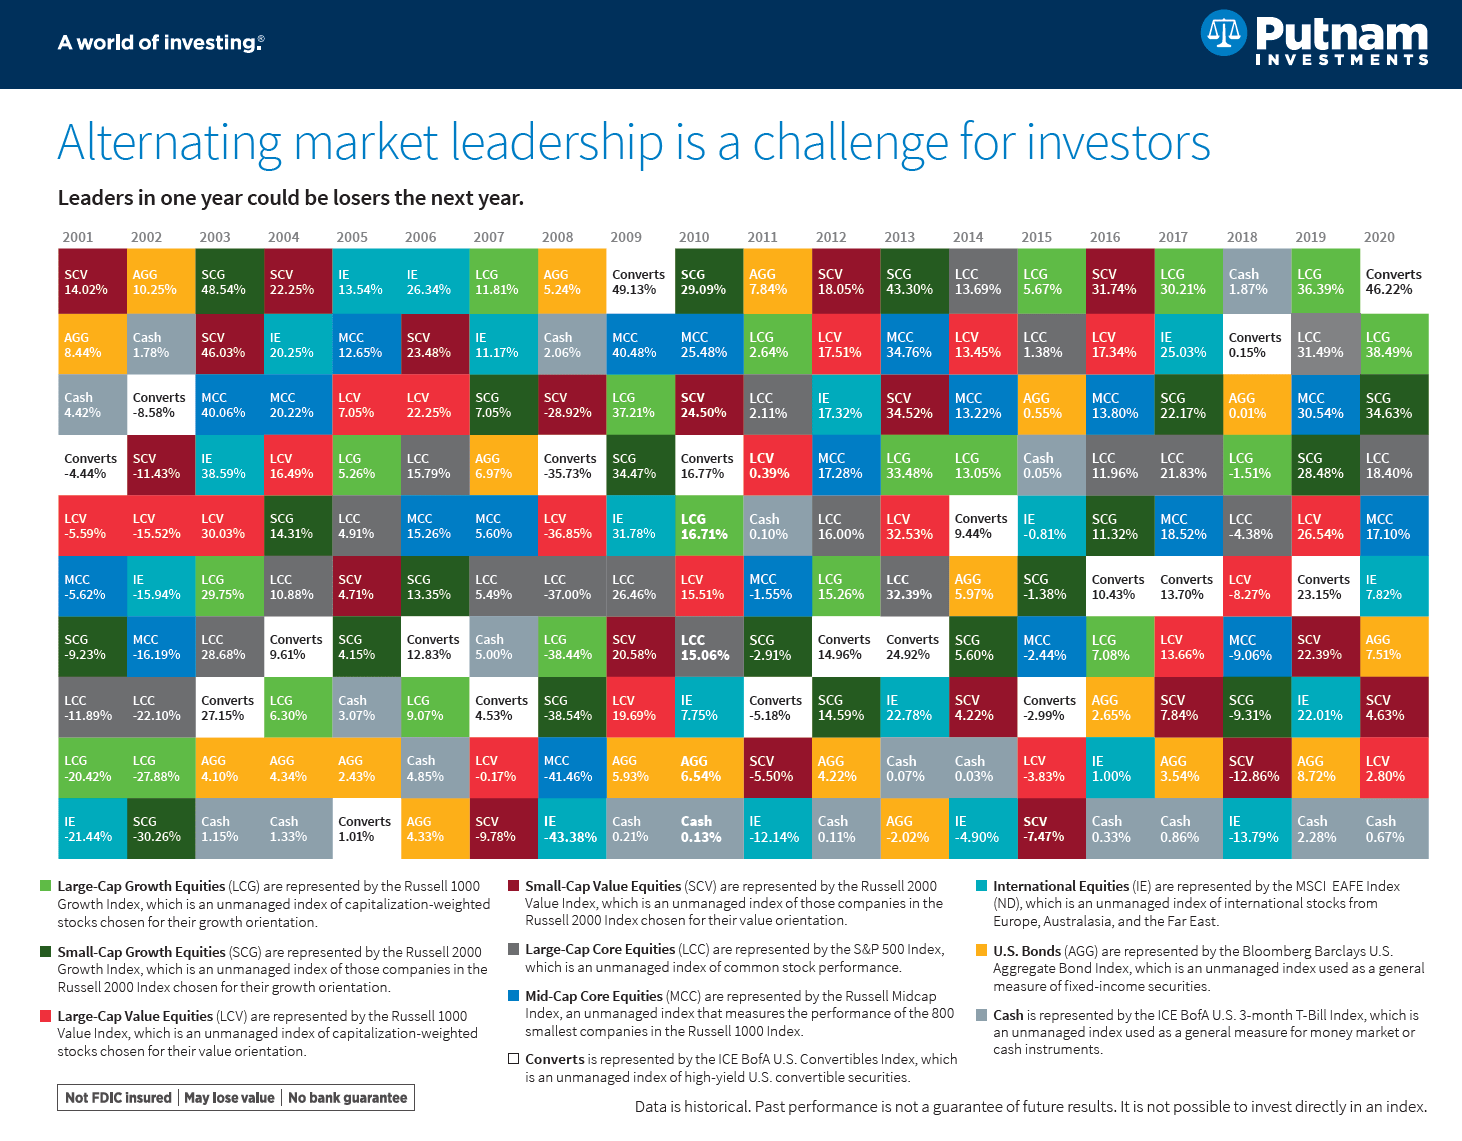
Source: Putnam Investments
Related ETFs:
- SPDR S&P 500 ETF (SPY)
- S&P MidCap 400 SPDR ETF (MDY)
- SPDR Consumer Discretionary Select Sector SPDR Fund (XLY)
- SPDR Consumer Staples Select Sector SPDR Fund (XLP)
- SPDR Energy Select Sector SPDR Fund (XLE)
- SPDR Financials Select Sector SPDR Fund (XLF)
- iShares Dow Jones Select Dividend ETF (DVY)
- SPDR S&P Dividend ETF (SDY)
- Vanguard Dividend Appreciation ETF (VIG)
- Vanguard MSCI Emerging Markets ETF (VWO)
- Vanguard Developed Markets Index Fund ETF (VEA)
- iShares MSCI Emerging Markets ETF (EEM)
Disclosure: No Positions