The Average Hourly Labor Costs Across the European Union: Chart

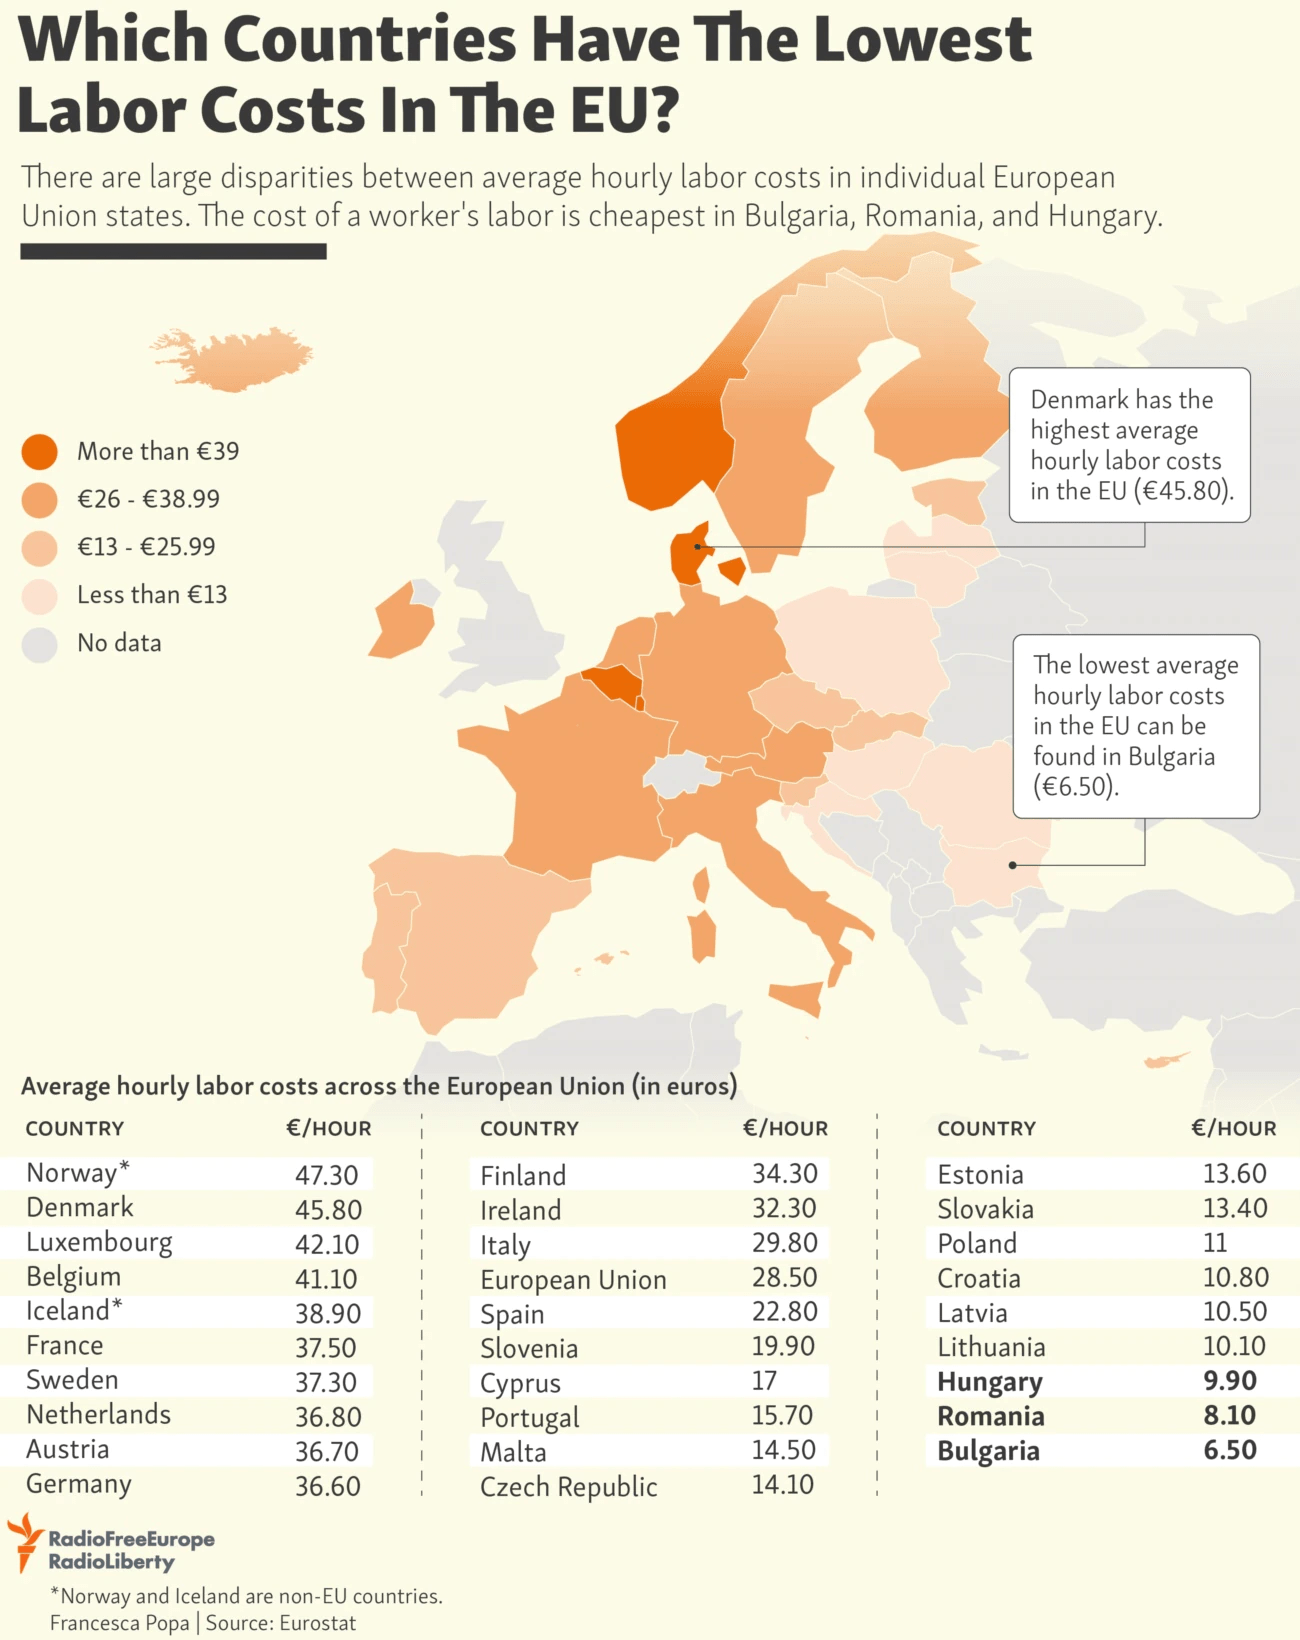
The Average Hourly Labor Costs Across the European Union is shown in the chart below. The highest hourly wage is in Denmark at €45.80. The lowest hourly wage is in Bulgaria at €6.50. The next two lowest hourly wage countries Hungary and Romania.

As expected the hourly wage in East European countries are much lower than in Western Europe. For example, a factory in Germany may have to pay €36.60 while across the border in Poland it needs to pay just € 11.0. The cost savings are indeed quite high.

Click to enlarge


Source: RFE/RL Infographics

In the US, the Federal minimum wage is $7.25 per hour. However most states have their own minimum wage laws. Many US firms especially in the manufacturing industry save substantial labor costs by their production facilities to Mexico where the minimum Federal wage is just 141.70 pesos per day or about $7.08 per day.

S&P 500 Calendar Year Returns 1925 To 2020: Chart

Equities are the best asset class to own for building wealth over the long-term. Stocks tend to yield a positive return when held over many years. However this does not mean they go up year after year consistently. Instead over many decades there will be some years where the market shoots higher and some when the market declines. To put it another way, bull market will be followed by bear market and vice versa. The key point to remember is by holding stocks for the long-term investors can even out the positive and negative returns and still earn a positive return as positive years are greater than negative years.

In fact, since 1946 there have been 14 bear markets. But each one of them ended leading to a bull market. The following chart shows the calendar year returns for the S&P 500 index from 1925 to 2020:

Click to enlarge

Source: 5 Lessons From the Bear Market, Fleming Watson

The average annual returns since 1925 is 10.48%.  Though it is highly unlikely one would hold stocks for such a long period, still in shorter decades, positive return years far outweigh negative return years.

Hence the key to success with equity investing is to hold quality stocks for years waiting out periods of adverse markets. The dramatic crash of stocks in early 2020 and the spectacular rise in a few short months is a classic example of this scenario.

Related ETF:

  • SPDR S&P 500 ETF (SPY)

Disclosure: No Positions

Commodities Go Through Periods of Booms and Busts

Investing in commodities is not for the faint-hearted. It takes nerves of steel to endure years of pain. Generally for most retail investors, investing in commodities directly is not a wise strategy. However commodities do have a role in a well-diversified portfolio. So adding a small percentage of gold for instance can help protect a portfolio during adverse equity market conditions. With that short intro, the following chart shows the growth of $1 from 1970 thru Jan, 2021. The S&P GSCI Index is considered as the benchmark index for commodities:

Click to enlarge

Source: How commodities can play an increasingly important role in portfolio diversification, Russell Investments

Over about four decades from 1970, commodities earned an annualized return of 6.24%. However from mid-2008 through Jan, 2021 commodity investors have suffered years of pains. The annualized return over this period of over a decade was a loss of 12.7%.

Below are the most actively traded commodities in the world:

  • WTI Crude Oil
  • Brent Crude Oil
  • Natural Gas
  • Soybeans
  • Corn
  • Gold
  • Copper
  • Silver

Source: Futures Industry Association

Related ETFs:

  • SPDR Gold Trust ETF (GLD)
  • United States Oil Fund LP (USO)
  • iShares Silver Trust (SLV)

Disclosures: No Positions

Related article:

Notable S&P 500 Drawdown and Recovery Cycles: Chart

The dramatic decline of the S&P 500 last March and the subsequent melt-up is one of the faster recoveries in the history of the index. The benchmark index fell 34% by late March of 2020 only to completely recover all that loss in less than 6 months. Previous drawdowns such as the dot-com bubble crash took more than 70 months to recover as shown in the chart below:

Click to enlarge

Source: Morningstar via Bourbon Financial Management

Related ETF:

  • SPDR S&P 500 ETF (SPY)

Disclosure: No Positions

Railroad Stocks Offer Excellent Long-Term Investment Opportunities

One of the best sectors to invest for the long-term is the North American railroad sector. Railroad stocks offer many unique advantages over stocks from other sectors. For instance, the industry is dominated by a handful of companies effectively making it an oligopoly. Moreover for many shippers or locations, railroad companies are a monopoly. I have written about this industry many times over the years. Some of those posts are:

Yesterday’s journal had interesting piece on the long-term investment case for railroads. From the article:

Since Warren Buffett’s Berkshire Hathaway BRK.B 0.21% announced in November 2009 that it would pay $44 billion including assumed debt for Burlington Northern Santa Fe, the market value of North American railroads has risen sharply. That is despite a collapse in demand for the most lucrative commodity that they hauled prior to Mr. Buffett’s deal—coal shipped to power plants—and the fact that volumes have been sluggish for about three years.

An equal-weighted basket of shares of the remaining six Class 1 North American railroads bought the day before Berkshire Hathaway announced the deal would have had a total return of 862% through Monday compared with less than 300% for the S&P 500. Kansas City Southern, including the jump following announcement of its merger with Canadian Pacific, is the best performer over that time with a more than 1,000% return.

A successful deal could bode well for other players if it unlocks further consolidation. Analyst Bascome Majors of Susquehanna Financial Group notes that more deals could follow after 2022 if the official attitude toward consolidation has improved.

But even if the deal is blocked by the Surface Transportation Board, there are reasons to like railroads. A big one is the spread of precision-scheduled railroading—a management concept that has increased efficiency and train speeds but annoyed some smaller customers. Kansas City Southern’s operating ratio, a measure of efficiency, improved to 60.7% last year from 72.8% a decade earlier. And, as concerns mount over global warming, trains are well-placed to take advantage given their far greater fuel efficiency per ton mile than trucks for intercity freight. Railroads are also an excellent hedge against rising energy prices, truck-driver shortages or worsening highway congestion. More expensive diesel often leads to an uptick in rail traffic.

Source: Railroads, Growth Stocks of the 19th Century, Are Hot Again,By By Spencer Jakab, WSJ

I agree with the author’s arguments in favor of railroads.

The following chart shows the price return of Class I railroads in the past 5 years:

Click to enlarge

Source: Yahoo Finance

CSX (CSX) was the best performer in the past 5 years while Canadian National (CNI) was the worst. Still CNI stock increased by nearly 88%.

From an investment perspective, investors with a horizon of 5 years or more can consider adding railroads during market dips in a phased manner.

Disclosure: Long CSX, CNI, UNP and NSC