The dramatic decline of the S&P 500 last March and the subsequent melt-up is one of the faster recoveries in the history of the index. The benchmark index fell 34% by late March of 2020 only to completely recover all that loss in less than 6 months. Previous drawdowns such as the dot-com bubble crash took more than 70 months to recover as shown in the chart below:
Click to enlarge
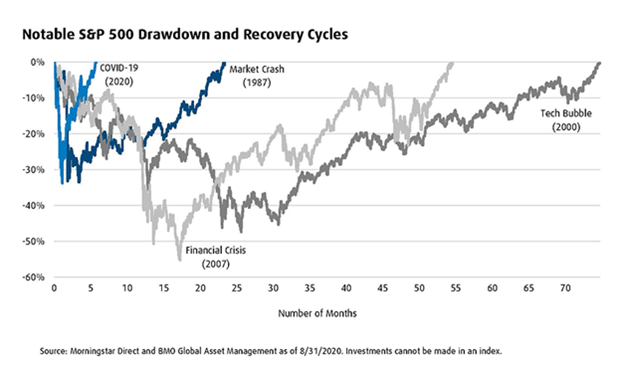
Source: Morningstar via Bourbon Financial Management
Related ETF:
- SPDR S&P 500 ETF (SPY)
Disclosure: No Positions


