Equities are the best asset class to own for building wealth over the long-term. Stocks tend to yield a positive return when held over many years. However this does not mean they go up year after year consistently. Instead over many decades there will be some years where the market shoots higher and some when the market declines. To put it another way, bull market will be followed by bear market and vice versa. The key point to remember is by holding stocks for the long-term investors can even out the positive and negative returns and still earn a positive return as positive years are greater than negative years.
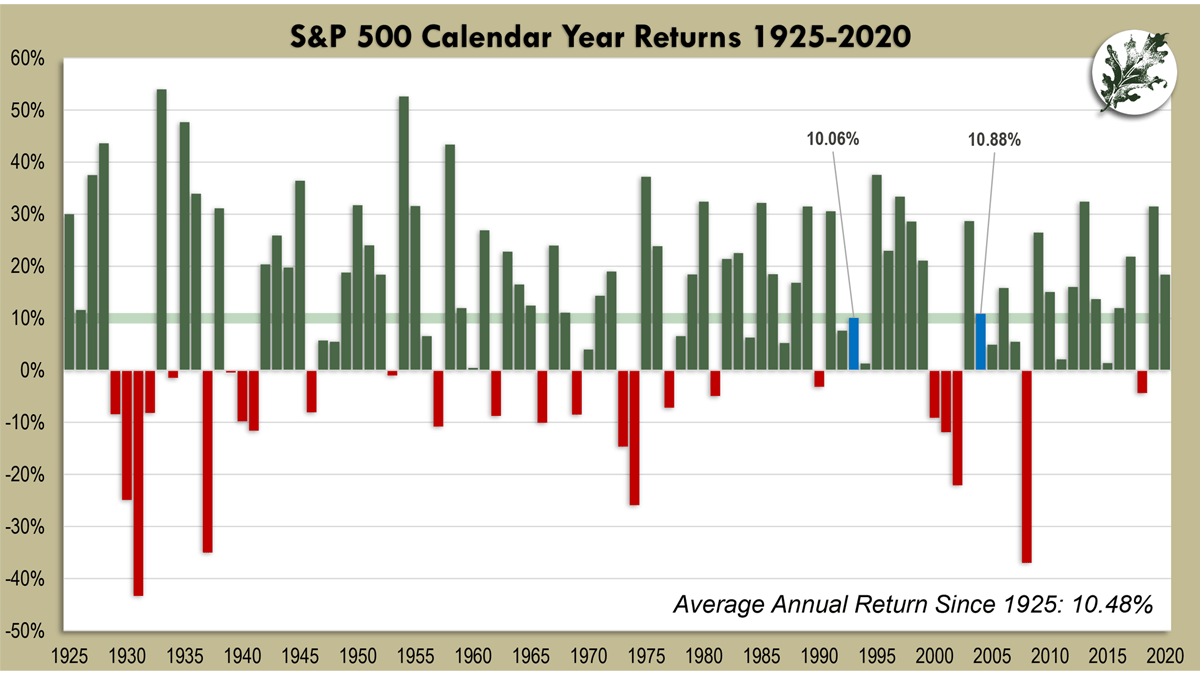
In fact, since 1946 there have been 14 bear markets. But each one of them ended leading to a bull market. The following chart shows the calendar year returns for the S&P 500 index from 1925 to 2020:
Click to enlarge
Source: 5 Lessons From the Bear Market, Fleming Watson
The average annual returns since 1925 is 10.48%. Though it is highly unlikely one would hold stocks for such a long period, still in shorter decades, positive return years far outweigh negative return years.
Hence the key to success with equity investing is to hold quality stocks for years waiting out periods of adverse markets. The dramatic crash of stocks in early 2020 and the spectacular rise in a few short months is a classic example of this scenario.
Related ETF:
- SPDR S&P 500 ETF (SPY)
Disclosure: No Positions