The updated version of the Periodic Table of Commodities Returns with 2022 data has been published by US Funds. Lithium was the best performing commodity last year with a return of about 73%. According to Frank Holmes of US Funds, this was the second year in a row that the “white gold” has soared to top all other metals. In 2021 it shot up by an astonishing 443%. As the demand for EVs continues to grow demand for Lithium will go up as well.
Crude oil and Natural gas were also top performers with the disruption in supply due to the Russian invasion of Ukraine.
Click to enlarge
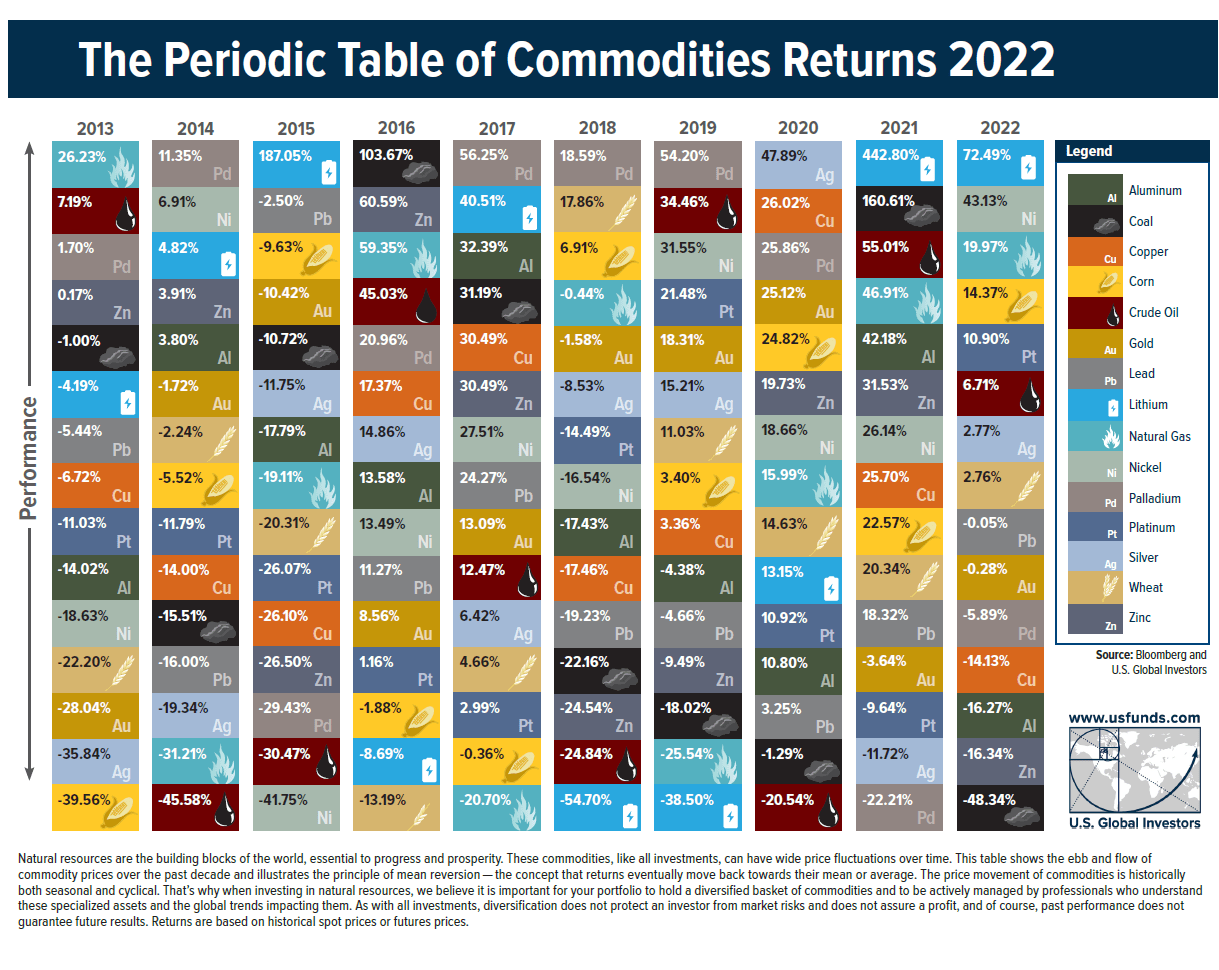
Source: US Funds
For an interactive table of the above chart go to the above link.
Related ETFs and companies:
- Barclays Bank iPath Pure Beta Crude Oil ETN Exp 18 Apr 2041 (OIL)
- Albemarle Corporation (ALB)
- Sociedad Quimica y Minera de Chile (SQM)
- SPDR Gold Trust (GLD)
Disclosure: No positions