The S&P 500 index declined by about 20% in 2022. Though the index is in the positive so far this year it remains to be seen if it will end the year with a decent return. With a recession on the horizon and interest rates expected to rise higher, volatility might still appear its ugly head. However it is important to remember that volatility in equity markets is normal. The S&P 500 index has had intra-year declines of double digit percentage points in many years and ended up the year with a positive return as the following chart shows:
Click to enlarge
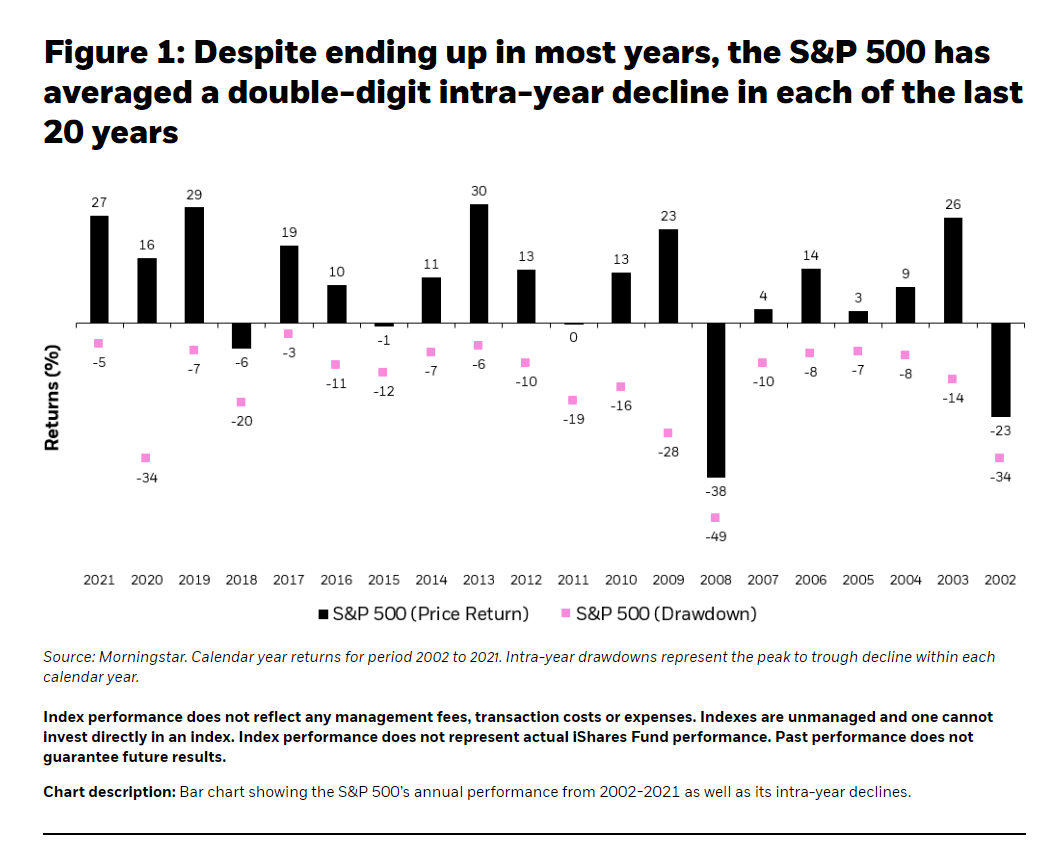
Source: 3 core lessons every investor needs to know by Daniel Prince, iShares
Below is another take on the S&P 500 intra-year drawdowns and calendar-year returns from 1980 to 2021:
Click to enlarge
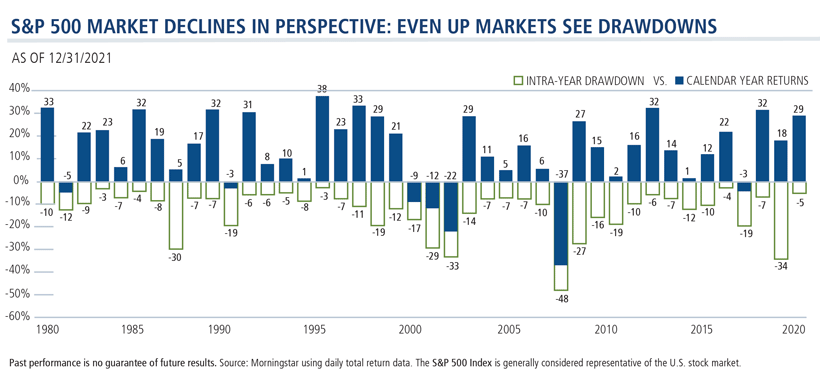
Source: Significant Intra-Year Drawdowns Are Common by Scott Becker, Calamos Investments
Related ETFs:
- SPDR S&P 500 ETF (SPY)
- iShares Core S&P 500 ETF (IVV)
- Vanguard S&P 500 ETF (VOO)
- SPDR Portfolio S&P 500 ETF (SPLG)
The Complete List of Constituents of the S&P 500 Index can be found here.
Disclosure: No positions


