Callan has published their famous The Periodic Table of Investment Returns 2022 edition. This chart shows the annual returns of key indices ranked in order of performance for each calendar year. Last year when most equities declined cash equivalent was the king with a return of 1.46%. REITs were the worst as rising interest rates and other factors crushed the sector. US large caps almost ended the year in bear market.
Click The Callan Periodic Table of Investment Returns 2004 To 2023: Chart for the latest chart.
Click to enlarge
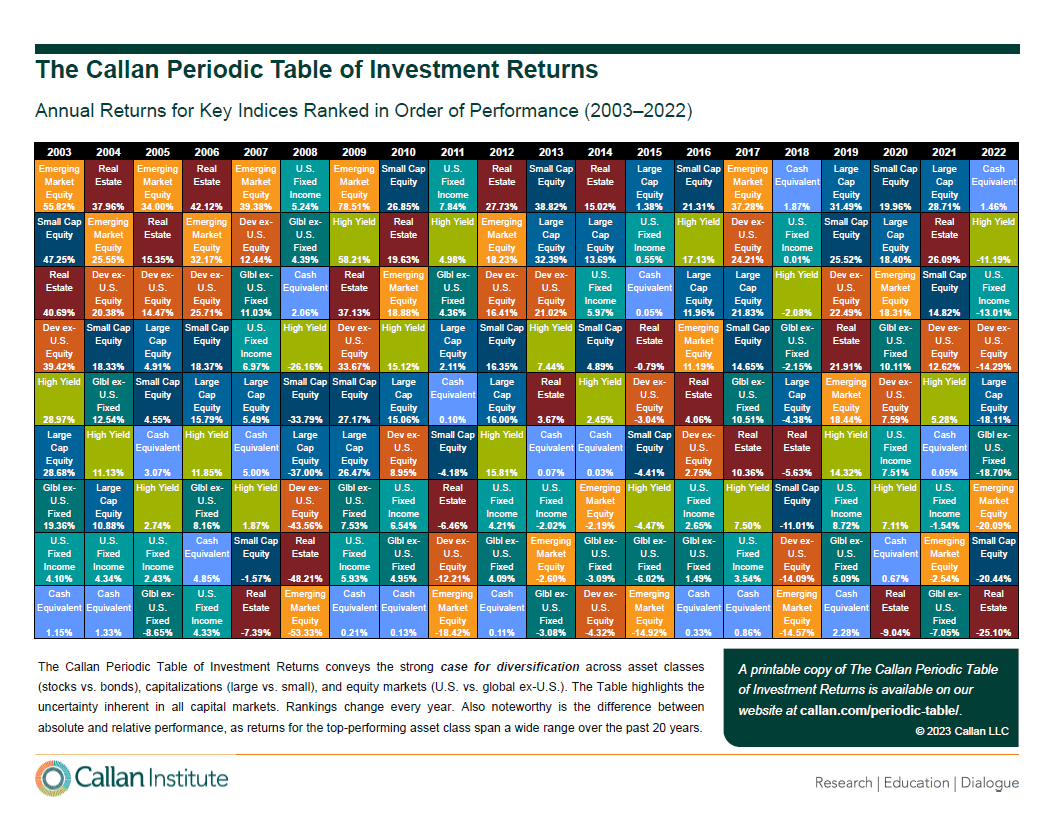

Source: Callan
You can download The Callan Periodic Table of Investment Return in pdf format at Callan’s site by clicking the above link.