Callan has released the latest edition of The Periodic Table of Investment Returns chart. The 2023 chart shows the annual returns of key indices from 2004 to 2023 in order of performance for each year. Last year US large caps as denoted by the S&P 500 was the top performer with a return of over 26%. Developed markets excluding the US underperformed relative to the S&P 500 but still grew by nearly 18%. The worst performer was cash with a decent return of over 5%.
Click to enlarge

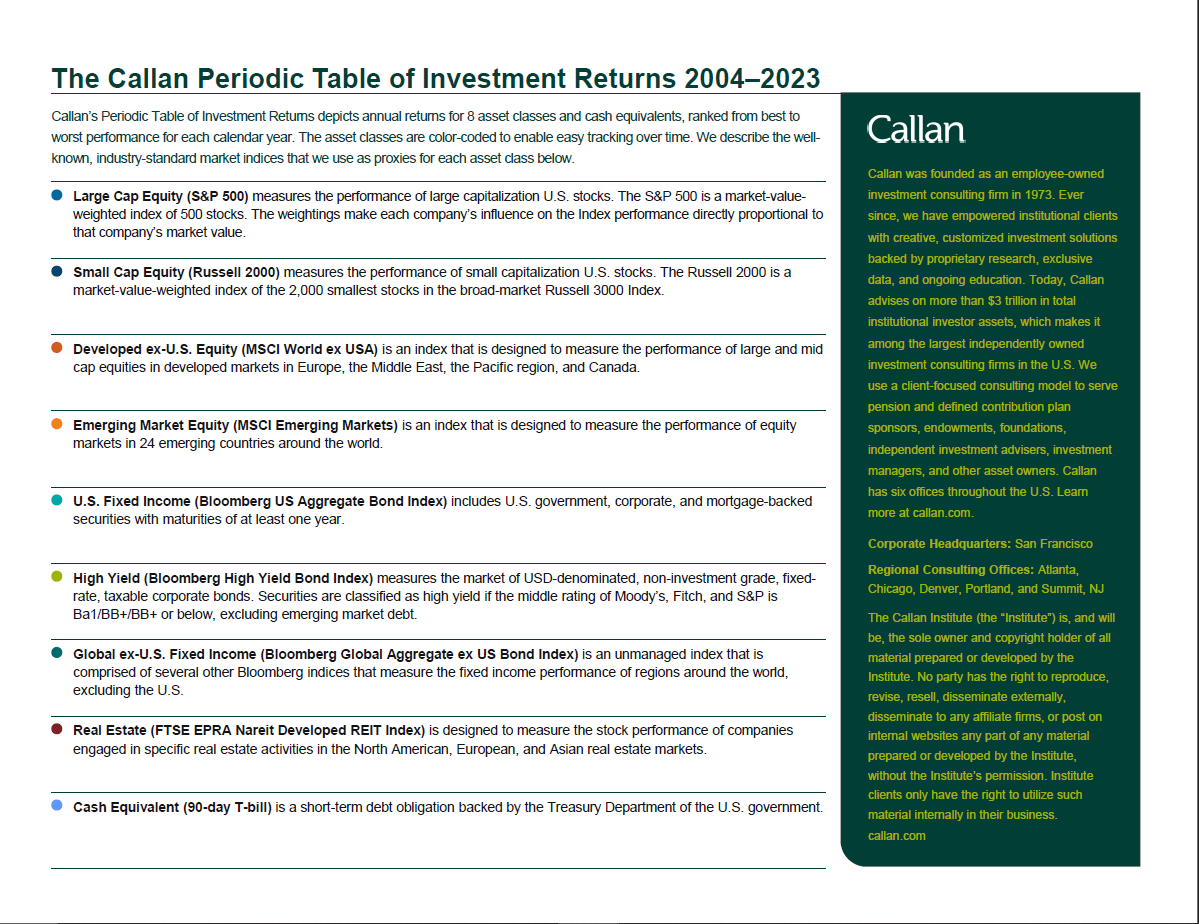
Source: Callan
Download Callan 2023 chart in pdf format:
Related ETFs:
- SPDR S&P 500 ETF (SPY)
- Vanguard Developed Markets Index Fund ETF(VEA)
- Vanguard MSCI Emerging Markets ETF (VWO)
- iShares MSCI Emerging Markets ETF (EEM)
- Vanguard Total Bond Market ETF (BND)
Disclosure: No positions


