The Evolution of the British Stock Market

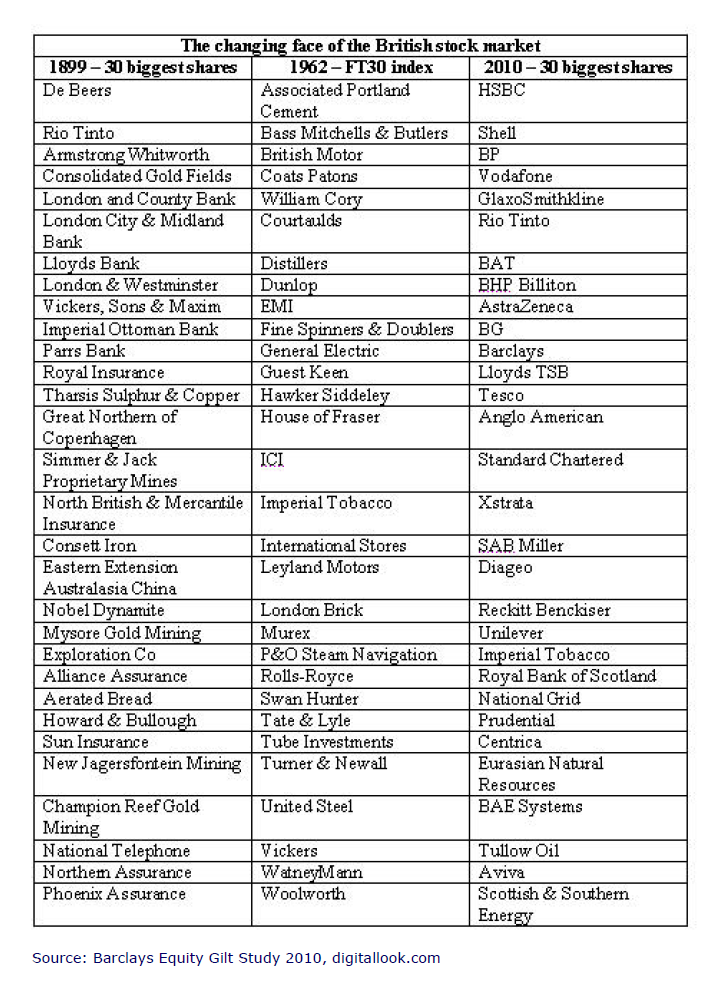
In an earlier post, we looked at the Historical Components of Dow Jones Industrial Average since 1896. The chart below shows the evolution of the British stock market since 1899:

Click to enlarge
british-stock-market-evolution.png

Source: The Barclays Capital Equity Gilt Study

Reinvestment of dividends is an important tool to increase the total returns earned on an equity investment. The Barclays study confirms this theory again.

“With 110 years in its database now, Barclays calculates that £100 invested in the UK stock market in 1899 would have grown to £11,407 by the end of 2009 in terms of capital appreciation alone. If dividends from the shares had been reinvested, however, the same £100 would have grown to a scarcely believable £1.49m. ”

Companies from just four sectors that dominate the British equity market today. These sectors are mining, financials, oil and pharmaceuticals. Similarly in the early 1900s, the market had concentration in the finance and mining industries. In the first column of the above chart we see companies like Lloyds Bank(LYG), Royal Insurance, Northern assurance, etc. in the financial sector and many mining companies in that sector.

Disclosure: Long LYG
The Top 15 Global Oilfield & Drilling Service Companies

This week oil driller Ensco plc(ESV) announced the acquisition of competitor Pride International (PDE) in a cash and stock deal valued at $7.3 billion. According to the deal, shareholders of Pride will receive a 0.4778 Ensco share and $15.60 in cash for each Pride share they own. This offer represents a 21% premium to Pride’s stock price as of Feb 4th.

From a Bloomberg article suggesting that this deal may spur more mergers in the industry:

Rowan Cos., a Houston-based operator of shallow-water rigs, and DryShips Inc.’s Ocean Rig UDW unit may be the next targets for drillers eager to expand fleets as the search for offshore oil and natural-gas fields intensifies, said Brian Uhlmer, an analyst at Global Hunter Securities LLC in Houston.

Buying competitors is an alternative path to growth amid a building boom for deep-water rigs that Barclays Plc analyst James West said is reducing shipyard space from South Korea to Finland.

“This industry is fairly scattered and consolidating this and moving forward on a basis of strength rather than speculation is always a good thing,” said Esa Ikäheimonen, chief financial officer of Seadrill Ltd. today in a telephone interview. Seadrill, based in Bermuda, hasn’t decided yet whether to shed its 9.4 percent stake in Pride and use the cash to pursue other targets, said Ikäheimonen.

Companies in this industry offer their highly-specialized technical expertise to the major oil firms. The success of the oil giants depends on smaller companies like the oil-drillers and other service providers. So investors looking to research into companies in the oil drilling industry may want to start with the world’s top companies noted below:

[TABLE=878]

Source: PFC Energy

Disclosure: No Positions

Will the Chinese Housing Bubble Pop Soon?

The real estate market in China has not yet crashed despite being a bubble for many months now. While the Chinese government has had some success in curbing excess speculation in major cities,  developers are finding other places to continue their growth and in the process may create bigger bubbles. A recent article in Bloomberg says that Chinese builders are moving to Tier II and Tier III cities for expansion as the cities of Shanghai and Beijing are adversely impacted due to recent government measures to curb wild speculation in the market. From the article:

Cheaper land and rising incomes in inland cities are luring developers as the government targets speculators, focused on Shanghai and Beijing, with stricter mortgage requirements and property taxes. Land investment in less affluent cities jumped 35.4 percent in the past year, according to data from China Real Estate Information Corp., which tracks 40 publicly traded developers.

“Absolutely policy is a driver of this, both because the policy’s footing in more developed cities is stricter and also because there is tremendous unmet demand for modern housing in these second-tier cities where incomes are rising quickly,” said Michael Klibaner, head of China research at Jones Lang LaSalle Inc. in Shanghai.

First-tier cities include wealthier Shanghai, Beijing and Guangzhou, in southern China, according to China’s National Bureau of Statistics. The second tier includes provincial capitals and the third includes smaller cities.

Buying Land

Residential land costs in the central city of Wuhan averaged 1,662 yuan per square meter in January, compared with Beijing’s 4,145 yuan and 5,692 yuan in Shanghai, according to SouFun Holdings Ltd., China’s biggest real estate website.

“Everyone agrees that opportunities lie in second- and third-tier cities, including us,” said Yang Haisong, a Hong Kong-based spokesman for China Overseas Land & Investment Ltd., a state-owned developer. “There are more cities in that category and their home prices have more room to rise.”

Hong Kong-based China Overseas, which started expanding in the country’s interior five years ago, posted its biggest increase in sales volume in northern China in December. It sold 1.5 million square meters (16 million square feet), a 67 percent jump from the same period a earlier, in the region that includes Shenyang, Changchun, Dalian and Qingdao.

“Top cities are increasingly mature: people are actually going to be second-, third- or fourth-time buyers,” said Wee Liat Lee, a Hong Kong-based property analyst at Samsung Securities Co. “If you go to these lower-tier cities, a lot of them are first-time buyers. You are tapping into fundamental demand, with no restrictions.”

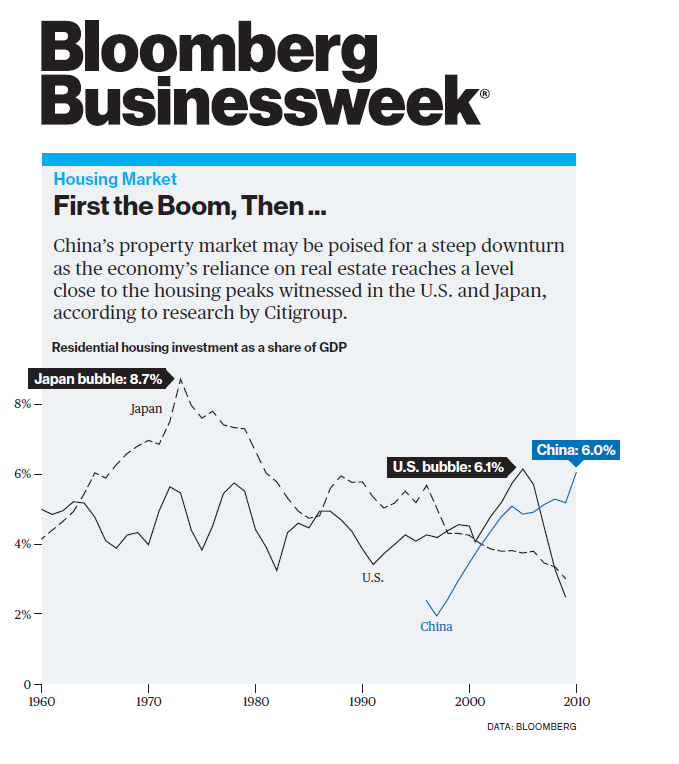
Despite the expected strong growth in the smaller towns and cities across China, investing in the Chinese real estate market is not a good idea now. Based on one measure, the Chinese housing bubble may be poised to pop as shown in the chart below:

china-housing-bulble.png

Source: Bloomberg BusinessWeek

Review:The Callan Periodic Table of Investment Returns 2010

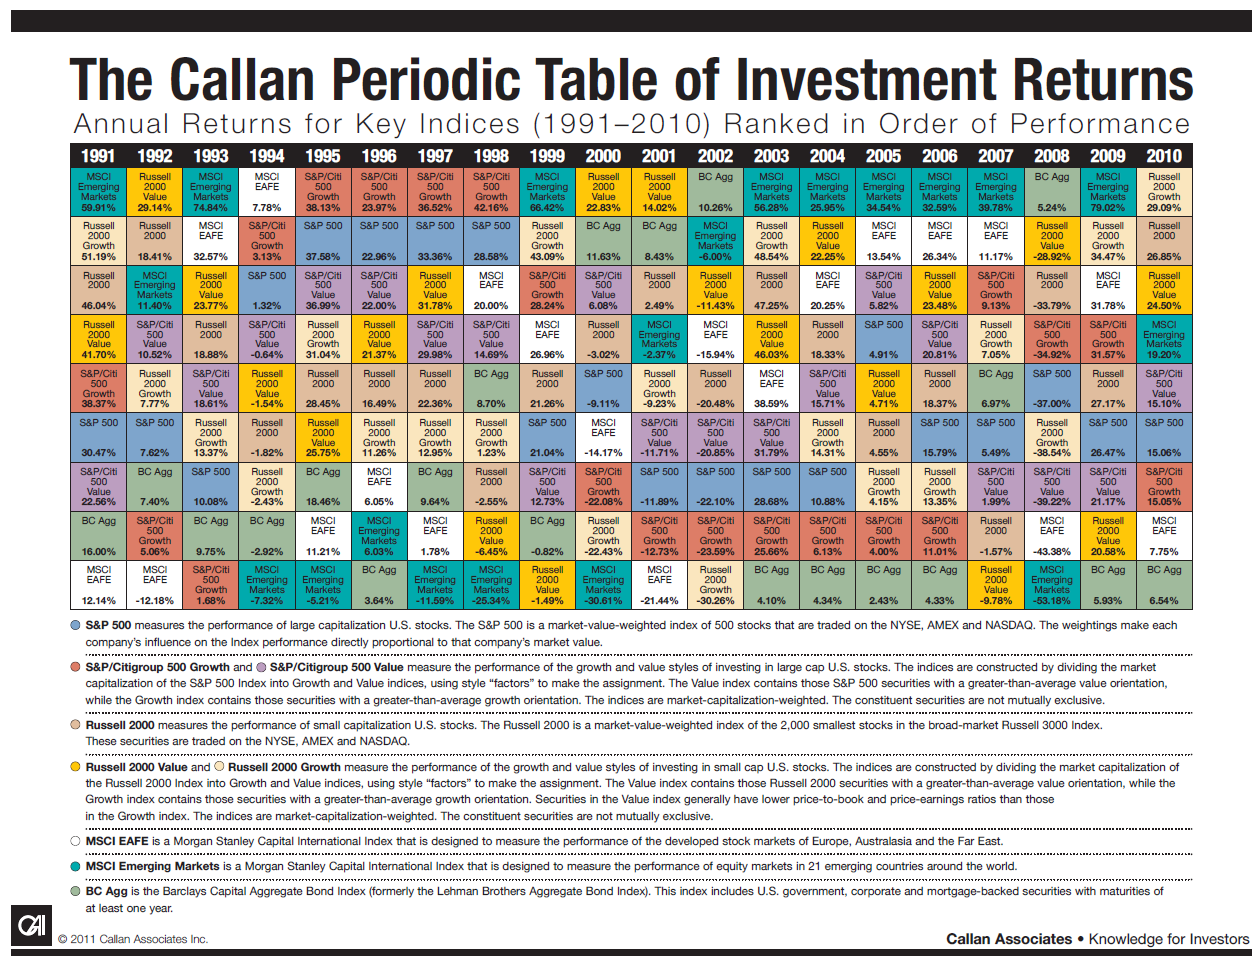
Callan Associates has published their famous Periodic Table of Investment Returns for 2010. The chart below shows the annual returns for key indices from 1991 thru 2010 ranked in the order of performance:

Click to enlarge

Callan-Chart-2010

Source: Callan Associates

Some observations:

1. After raking up double digit gains in 2009, markets around the world gained further in 2010. U.S. markets performed better (15.1%) than the developed overseas markets which had a return of just 7.8.%.

2. Emerging markets completely erased the 53.2% loss of 2008 by rising 19.2% in 2010 and 79% in 2009.

3. For the second year in a row, all categories of equities had positive returns for the second year in a row.

4. Small caps(26.9%) outperformed large caps(15.1%) for the tenth year out of the last 12.

5. The S&P 500 yielded double digit returns two years in a row.

6. U.S. largecap stocks performed extremely well in the period from 1995 thru 1998 when the technology took off.

7. Once again this chart shows the importance of diversification since the returns of asset classes differ each year and sometimes there can be a reversal in pattern such as last year when U.S. stocks outperformed other developed market stocks.

Related posts:

The Callan Periodic Table of Investment Returns 2009 

The Callan Periodic Table of Investment Returns for 2008

Why Diversification Still Matters

Related: The Callan Periodic Table of Investment Returns 2016: A Review

Site Milestone Reached

Dear Visitor:

I started this humble blog in early 2008. In the 3+ years since, the site has grown tremendously. Yesterday this site reached a major milestone. For the first time, the Sitemeter Total PageViews exceeded 1,000,000.

Some stats from Sitemeter:

Total Page Views = 1,004,813

Total Visitors = 560,964

There are currently 1,135 posts contained within 104 categories.

On an average over 2,000 pages are viewed by visitors every day. Visitors come from many countries with the vast majority from the U.S., Canada and Europe.

My articles posted in SeekingAlpha receive much more traffic and comments than my site due to SA’s reach and audience.

Some Stats about my SeekingAlpha articles:

Total article published = 765

Followers = 69,180

Top three posts that received over 25,000 page views each in the last 12 months are:

34 S&P 500 Stocks Yielding More Than 5% Dividends

High Dividend Stocks in the Nasdaq

Goldman’s 10 Stocks for Dividend Growth

I am happy to let you know that articles from this site have been referred by many top sites including The Wall Street Journal Blog, Yahoo Finance, Random Roger, Barry’s The Big Picture, etc. and in a finance text book for college students.

Thank your very much for your support !!!.