Callan Associates, famous for its Periodic Table of Investment Returns also called the Callan Charts, has published the chart for 2008.
Some key points from last year’s chart:
- The US markets performed better than the international developed markets
- While the S&P was down 37%, the MSCI EAFE Index which measures the developed markets of Europe, Australasia and the Far East was off 43.38%
- The BC Agg (Barclays Aggregate Bond Index) which includes US Government and Corporate with maturities of at least 1 year was up by 5.24%
- Small Cap value (-28.92%) performed better than large cap stocks
- After double digit growth in the past 5 years, developed market equities fell in 2008 with a loss of 43.38%
You can download the complete pdf version of “The Callan Periodic Table of Investment Returns (Key Indices: 1989-2008)” by clicking here.
For “The Callan – Equity Return of Developed Markets Chart” which gives returns by individual countries upto 2007, go here.
Considering the collapse of equity markets worldwide since 2008 many investors are wondering if diversification is dead. According to a research paper released by Allianz Global Investors, diversification is still important. However diversification has to be done among various asset classes such as stocks, bonds and includes cash.
“The Importance of Diversification” Chart (click to enlarge):
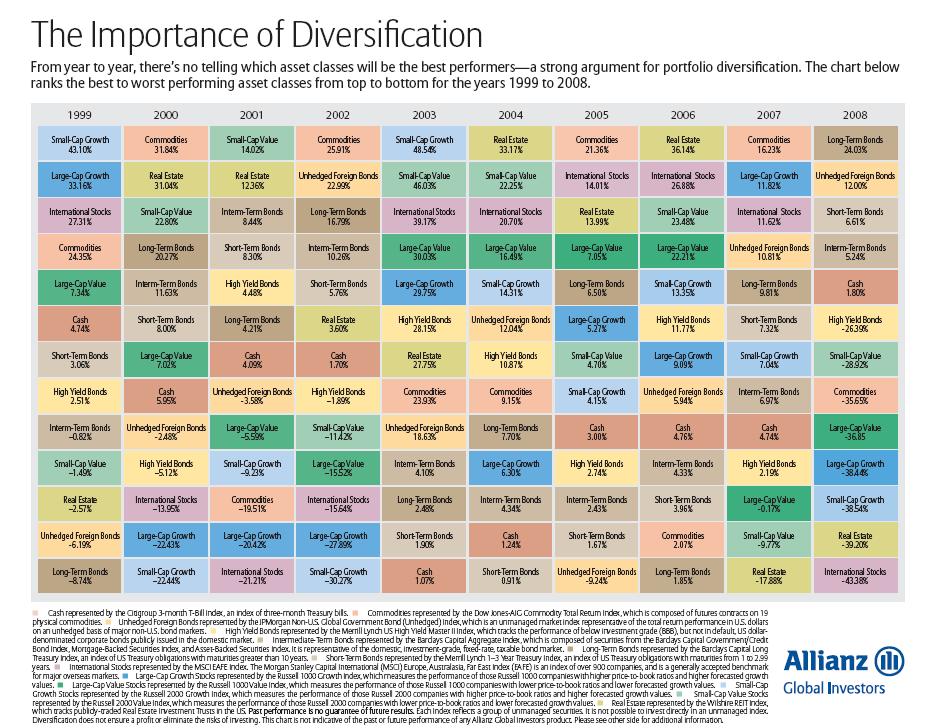
Source: Allianz Global Investors
Some observations from the chart:
- In 2008, long-term bonds were the best performers with a return of 24%
- Commodities fell about 36% and Real Estate was off 39%
- While long-term bonds did well, high-yield bonds fell by about 26%
Related: The Callan Periodic Table of Investment Returns 2016: A Review


