At the height of the global financial crisis in 2008 many banks in the developed world were on the edge of failure. To protect the financial system from total collapse, governments bailed out most of these institutions by injecting billions of dollars in capital. Some of these banks were bailed out by foreign banks and Sovereign Wealth Funds (SWFs). These bailouts were so large that they qualified as Foreign Direct Investment (FDI) according to a report by UNCTAD.
In the UK, the British government injected £37 billion into two of the largest banks, Llyods Banking Group (LYG) and Royal Bank of Scotland(RBS) there with additional support in the following year. These bailouts came with conditions such as the sales of branches by the recipients, reduction of market shares and others.
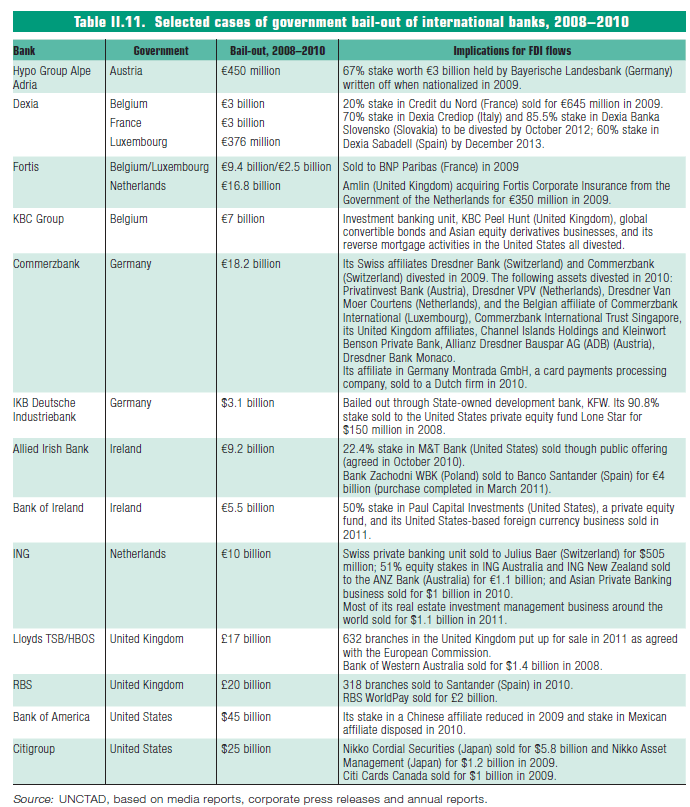
The table below shows the state bailout of select banks during the financial crisis:
Click to enlarge

Source: World Investment Report 2011, UNCTAD
While the governments were successful in preventing a global armageddon back then, it appears that the very institutions they rescued may require another bailout soon. With fear of losses mounting from exposures to the PIIGS countries some European banks need to raise additional capital to cushion against such losses.
The chart below shows the disastrous equity performance of six bailed-out banks since 2008:
Click to enlarge

Llyods Banking Group and RBS, both majority-owned by the British state, have been the worst performers with losses of about 95%. US-based Bank of America (BAC) and Citigroup (C) have not fared any better either with some experts suggesting that these TBTF banks should be split into multiple pieces for the benefit of the economy and also to increase competition in the banking industry. As many investors question the survivability of Bank of America, Barry Ritholtz of CEO and Director for Equity Research for Fusion IQ recently said in a Bloomberg interview that BofA should should seek a GM-style bankruptcy.
Disclosure: Long RBS, LYG, CRZBY, ING

