The Canadian banking system remained strong and stable during the Global Financial Crisis (GFC) of 2008. Unlike many European and American banks, banks in Canada did not require any form of bailout and the regulatory system won praise from many countries and global institutions such as the IMF. Since then however some have raised doubts about the strength of the Canadian banking system. I wrote a couple of articles on this subject last year which can be found here and here.
Recently Tyler Durden of Zero Hedge wrote an article saying that the majority of Canadian banks are also in bad shape based on the Tangible Common Equity(TCE) ratios. The following chart shows the top global banks ranked by TCE ratios with the lowest at the top:
Click to enlarge
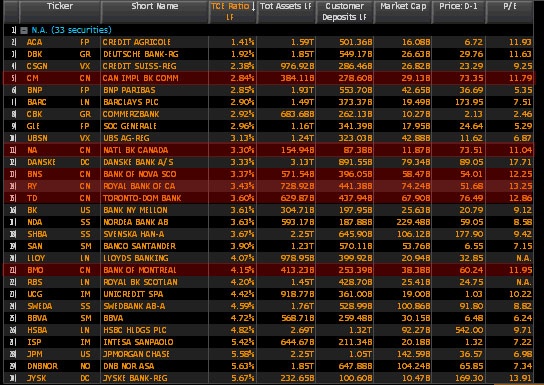
Source: Zero Hedge
Except Bank of Montreal, all the other four Canadian banks have TCE ratios of less than 4%. Tyler looked for banks that will have their equity wiped out with a reduction of 4% or less in their value of assets. Based on this logic, except Bank of Montreal Canadian banks are just as risky as their European and American peers.
In an article titled Is Zero Hedge looking at the wrong numbers? Boyd Erman of The Globe and Mail argues that Zero Hedge may have looked at the wrong numbers to make that conclusion. From the article:
In a simple analysis that generated a great deal of commentary, a blogger at Zerohedge.com, an oddball but widely followed financial site, suggested that Canadian banks were as leveraged as European banks because they have low ratios of tangible common equity to total assets.
But there’s an argument that looking at that ratio is the wrong way to judge a bank’s strength because it ignores the composition of the assets.
A better number might be the ratio of tangible common equity to risk-weighted assets.
In times of stress, analysts have focused on tangible common equity as a baseline measure of strength. It is calculated as the amount of equity a bank has, after excluding preferred equity and intangibles (whose value might be questionable in a crisis). Set that tangible equity against a bank’s assets, and you can see how much wiggle room a bank has if its assets start to go bad.
But what’s the best measure of assets? Is it total assets, as the Zero Hedge analysis assumes, or is it risk-weighted assets?
An argument for total assets and against risk-weighted is that risk-weighted involves judgement calls on the riskiness of loans and investments. In many cases, the judgements are made by banks and overseen by regulators. Assets such as Treasury bonds are judged much less risky than a loan to a consumer, for example. Banks with low-risk assets can carry less equity.
There’s no judgement in total assets. They are an absolute.
The argument the other way runs that by using total assets you are lumping in Canadian banks’ assets like mortgages with the Greek bonds on the balance sheets of European banks. In other words, while you think you’re getting an apples to apples comparison, you’re not adjusting for the fact that some apples are fresh and tasty and some are rotten.
Interestingly, a 2009 study by McKinsey found that, when looking at the global banking crisis from 2007 to 2009, the ratio of tangible common equity to risk-weighted assets was the best predictor of bank distress.
To answer my title question I would say that Canadian banks are indeed better than European and American banks based on the above analysis and many other factors. For example, mortgage loans in Canada are full recourse loans and hence banks can go after homeowners if they default on their mortgages. Canadian banks also have effective risk management policies and do not engage in reckless lending (subprime) or play the derivatives market.
Bank of Nova Scotia(BNS), Bank of Montreal(BMO), Canadian Imperial Bank of Commerce(CM) and Royal Bank of Canada(RY) currently have dividend yields of over 4% and Toronto Dominion Bank(TD) yields close to 4% based on Friday’s closing prices. TD is expanding big in the U.S. and Scotia bank has a strong presence in the Caribbean and Latin American countries.
Related article:
Canada’s banks: Next dominos to fall?
Disclosure: Long BNS, BMO, CM, RY, TD