Review: Callan Periodic Table of Investment Returns 2011

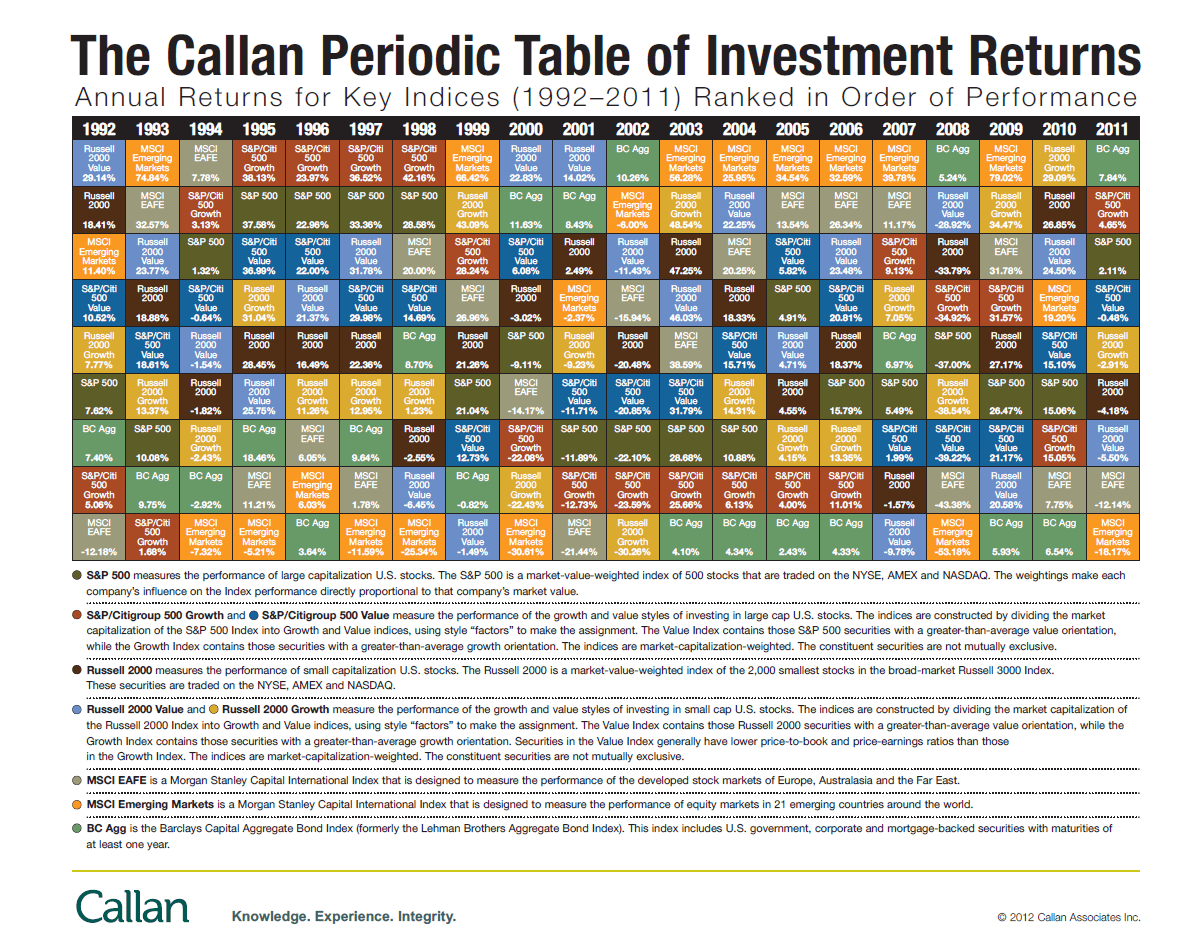
The Callan Periodic Table of Investment Returns for 2011 is shown below:

Click to enlarge


Source: Callan Associates

Some interesting observations noted by Callan include:

  • The U.S. markets generated a tiny 2.11% return which is better than the double digit losses for the overseas developed and emerging markets.
  • For only the third time in 13 years, small caps (-4.18%) trailed large caps (+2.11%) in 2011.
  • With a return of 7.84% fixed income was the best performing asset class last year.
  • In 2008 U.S. large cap stocks fell by 37%. The strong rallies of the S&P 500 in 2009 and 2010 were not enough to erase the losses of 2008. In addition, the lackluster performance in 2011 did not help the index get closer to the 2008 peak.

The Callan Charts for 2009 and 2010 can be found here and here.

Related ETFs:

iShares MSCI Emerging Markets ETF (EEM)
Vanguard Emerging Markets ETF (VWO)
SPDR S&P 500 ETF (SPY)
SPDR STOXX Europe 50 ETF (FEU)
SPDR DJ Euro STOXX 50 ETF (FEZ)
iShares iBoxx $ Investment Grade Corporate Bond Fund (LQD)
iShares Barclays US Aggregate Bond Fund(AGG)
Vanguard Total Bond Market ETF (BND)

Disclosure: No Positions

Related: The Callan Periodic Table of Investment Returns 2016: A Review
On the Dividend Yields of U.S. and Foreign Stocks

The New York Times published an interesting article this week discussing dividends paid by U.S. companies. The author Christine Hauser noted that the increased dividend payout last year is a sign of recovery.

From Dividends Rise in Sign of Recovery:

Companies listed in the Standard & Poor’s 500-stock index paid $240.6 billion in dividends in 2011, up from $205 billion in 2010. The 2011 payout was the largest since 2008, when firms had not yet been hit by the full brunt of the financial crisis and paid a record $247.8 billion in dividends.

Dividends are on track to set a record of more than $252 billion in 2012, according to data released by S.& P. that is based on the current dividend rates of 394 companies. While there could be some changes as the reporting season begins this week, analysts said companies were expected to continue to pay shareholders, possibly at the same rates or higher, as some of the economic and fiscal headwinds from 2011 tapered off.

“Dividends have been rising strongly,” said Binky Chadha, the chief strategist at Deutsche Bank. “And the rise that we have seen has plenty of upside.”

Companies that pay high dividends were some of the best performers in the markets last year.

Telecommunications, utilities and health care shares had the highest yield rates at the end of 2011, at 5.86, 4.13 and 3 percent, respectively.

I agree with the author’s conclusion since dividend payments come out of profits earned and is a strong indicator of a company’s financial performance.

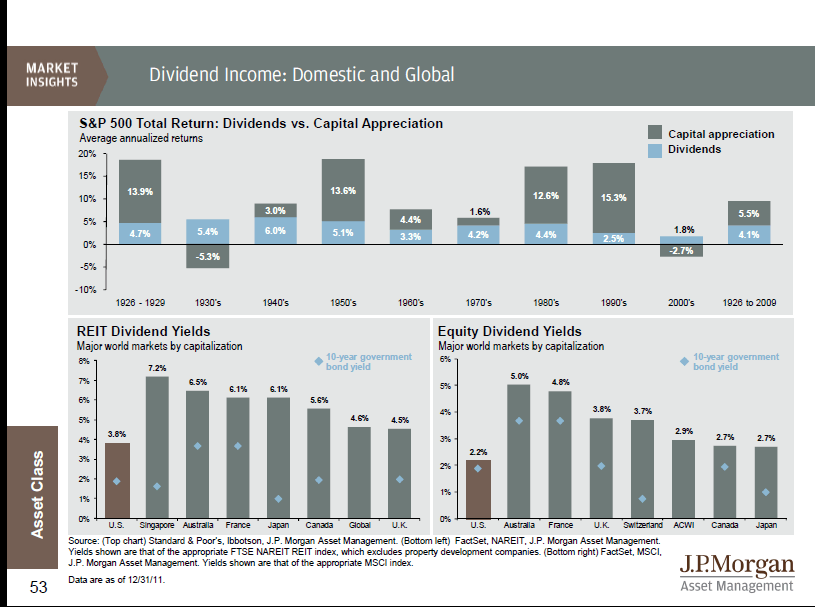
Though it is commendable that U.S. companies are increasing their dividend payouts, they still lag when compared to the payouts of foreign companies. Relative to their overseas peers, U.S. firms hold over one Trillion $ in cash and equivalents on their balance sheets. So much higher payouts are possible.

The current yield on the S&P 500 is 2.08%. At the end of 2011, the yield of the MSCI Index for U.S. stood at just 2.2% compared to much higher yields in other countries as shown in the graphic below:

Click to enlarge

Source: Guide to the Markets, 1Q 2012, J.P. Morgan Asset Management

While companies in certain industries in the U.S. have higher yields than the S&P 500, most of the others still hold a significant portion of profits as retained capital for future investment. Invariably these firms squander the funds on share buybacks, expensive acquisitions and other corporate actions due to short-term thinking by the management. In majority of the cases, these actions hurt long-term shareholders. Hence instead of narrowly focused on US firms, investors looking for dividend income should consider investing in foreign stocks. For example, most European companies have a tradition of paying high dividends in two installments per year. Though markets in Europe were crushed last year, excluding financials one can find other sectors which offer higher yields and growth.

Related ETFs:

SPDR S&P 500 ETF (SPY)
SPDR STOXX Europe 50 ETF (FEU)
iShares Dow Jones Select Dividend Index (DVY)
Vanguard European ETF (VGK)

Disclosure: No Positions

Impact of Inflation on Stock Returns

Investing in stocks produces the best return especially in the long-term. However when inflation is taken into account the return may not be the highest. Despite the best efforts of the U.S. Federal Reserve to combat inflation, it continues to grow year after. Inflation growth is particularly high in certain service industries such as health care, tax preparation, banking, asset management, real estate brokerage, etc.

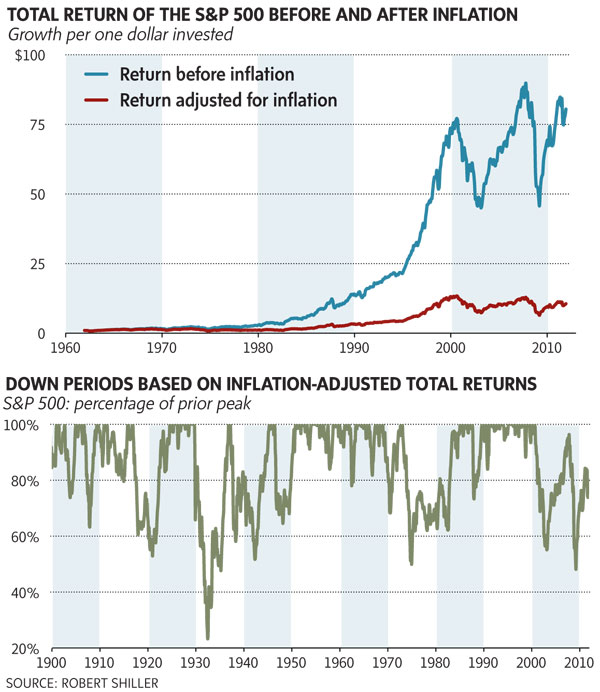
The following chart shows the total returns of S&P 500 since the early 1960s with and without adjustment for inflation:

Click to enlarge

Source: The scourge of inflation, The Globe and Mail

The total return on the S&P 500 since the early 1960s is an average of 9.6% per year. However when adjusted for inflation, the rate of return falls to just 4.8% per year. Since inflation affects taxes, asset management fees and others, the actual rate of return an investor earned during the period shown in the chart is only 1.3% when those factors are included in the rate of return calculation. Clearly 1.3% per year is not a great return for investing in  stocks.

The takeaway from this post is that investors should diversify their portfolio among various asset classes in order to earn an inflation-adjusted higher return. This would mean investing in stocks (in developed emerging markets), bonds (corporate, municipal and treasury), real estate, CDs, etc.

Related ETFs:
SPDR S&P 500 ETF (SPY)
SPDR DJ Euro STOXX 50 ETF (FEZ)

Disclosure: No Positions

A Review of MTR Corporation, Hong Kong’s Railway Operator

The MTR Corporation(MTRJY) is the leading railway operator in Hong Kong carrying an average of 4 million passengers every weekday. MTR’s rail network consists of nine railway lines serving Hong Kong Island, Kowloon and the New Territories. The company also runs a Light Rail network serving the local communities of Tuen Mun and Yuen Long in the New Territories.

In addition, MTR also operates the Airport Express, a dedicated high-speed link providing the fastest connections to Hong Kong International Airport and the city’s newest exhibition and conference centre, AsiaWorld-Expo. From Hong Kong MTR  provides convenient services to Guangdong Province, Beijing and Shanghai in mainland China.

Some of the other areas where MTR has interests include the development of residential and commercial projects, property leasing and management, advertising, telecommunication services and international consultancy services. Internationally the corporation is involved in the building and operations of the Beijing Metro Line 4 and Shenzhen Metro Line 4 and in the operating of the London Overground system in the United Kingdom, the Melbourne Train System in Australia and Stockholm Metro in Sweden.

MTR’s shares trade on the OTC market in the US through the Level 1 program with the ticker MTRJY. The ADR to ordinary shares ratio is 1:10. While the ordinary shares outstanding is about 5.7 billion, the majority is owned by the government Hong Kong which owns 76.7% of the shares. MTR has paid a dividend every year since going public in October 2000. The ADR closed at $32.76 yesterday and has a dividend yield of 2.73%.

For more information please visit MTR’s investor relations site.

Disclosure: No positions

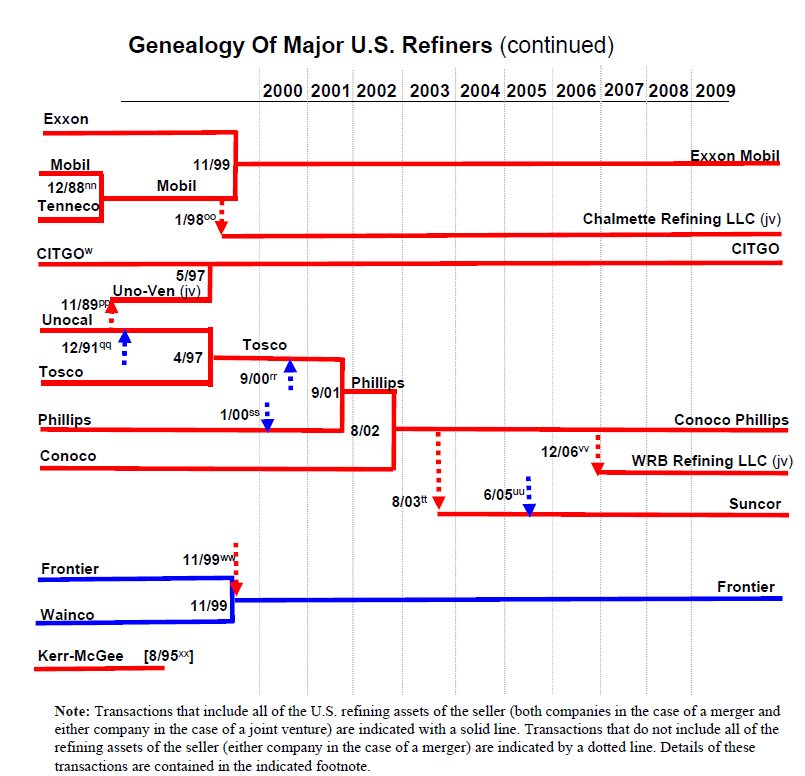
Genealogy of Major U.S. Refining Companies

The average retail gasoline price in the U.S. is around $3.50 per gallon this week. After reaching over $4.00 in 2008 prices dipped for a few months. From early 2009 prices have continued to increase steadily despite the recession. This is because the demand for gas is generally inelastic as most people have to buy gas no matter the price at the pump due to the lack of public transportation.

Among the multitude of reasons for the steady increase in gas prices over the year, one factor that is rarely discussed is the oil refining industry is not competitive. From an article in the Public Citizen Foundation:

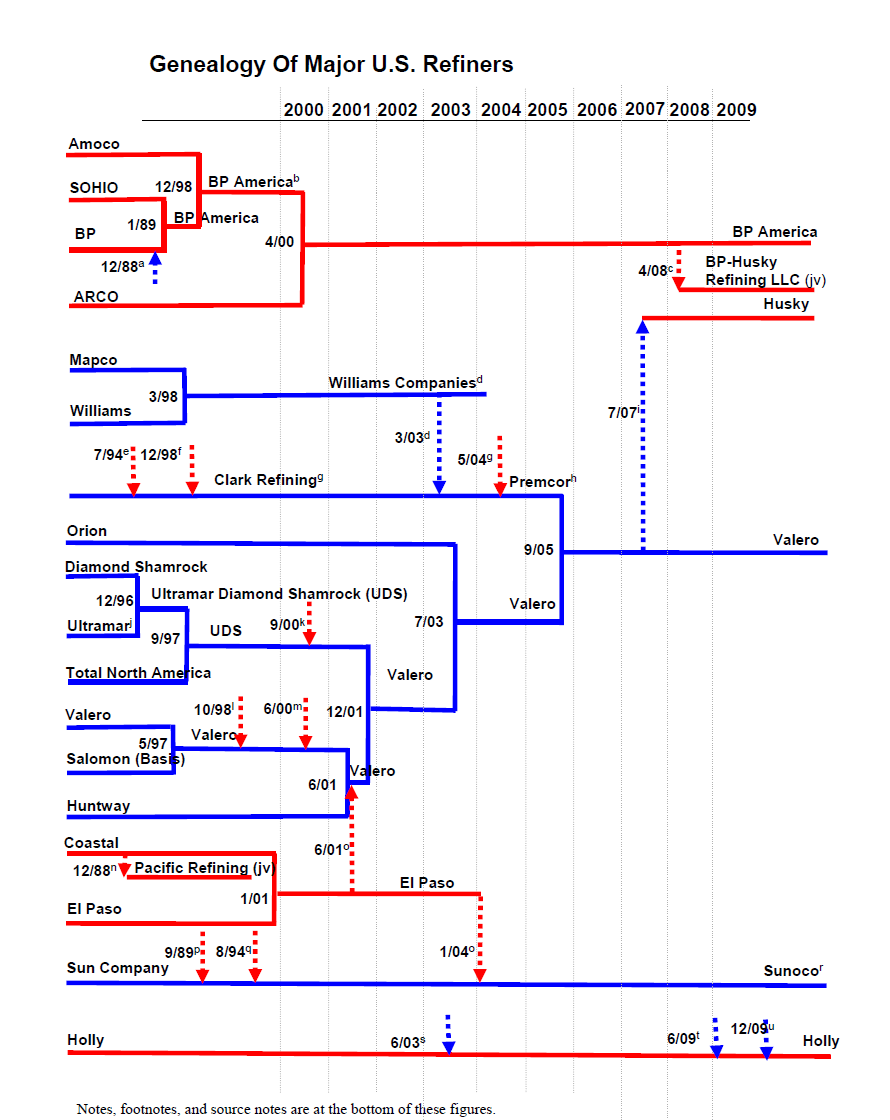
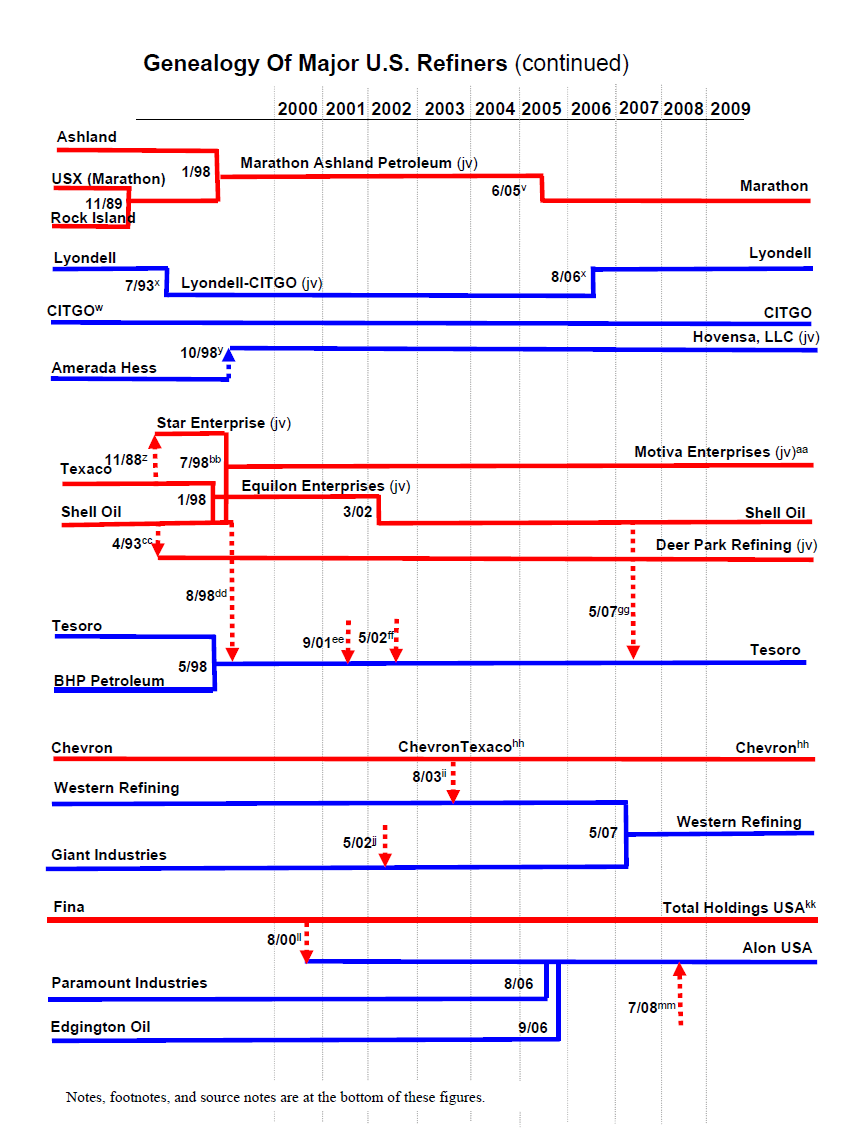
The largest five oil refiners in the United States (ExxonMobil, ConocoPhillips, BP, Valero and Royal Dutch Shell) now control over half (56.3%) of domestic oil refinery capacity; the top ten refiners control 83%. Only ten years ago, these top five oil companies only controlled about one-third (34.5%) of domestic refinery capacity; the top ten controlled 55.6%. This dramatic increase in the control of just the top five companies makes it easier for oil companies to manipulate gasoline supplies by intentionally withholding supplies in order to drive up prices.

The following charts show the evolution of the major refiners:

Click to enlarge

Source: Genealogy of Major U.S. Refiners, EIA

Related companies:

ExxonMobil (XOM)
ConocoPhillips (COP)
BP (BP)
Valero Energy Corp (VLO)
Royal Dutch Shell (RDS.A, RDS.B)

Disclosure: No positions