Historical P/E Ratio of the S&P 500 Index

The historical P/E ratio of the S&P 500 1926 to 2009 is shown below:

Click to enlarge
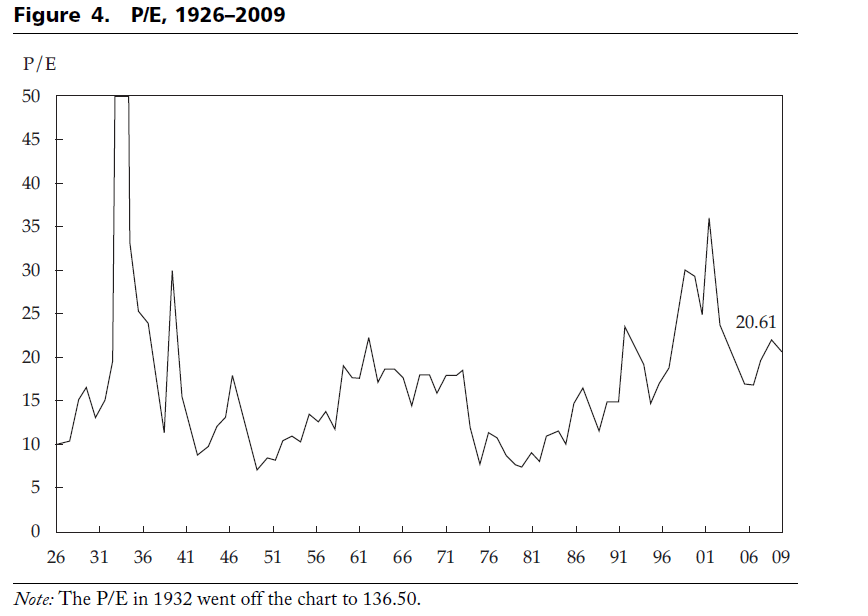
The Price to Earnings (P/E) ratio was at 10.22 in the beginning of 1926 and reached 20.61 in 2009—an average increase of 0.84% per year. The highest P/E ratio was 136.50, recorded during the bull market in 1932, and the lowest was 7.07, recorded in 1948.

The P/E ratio has never gotten to a level less than 5, even through the Great Depression during the 1920s and 1930s and the 2008–09 global financial crisis.

The P/E rose dramatically over the past 80 years because investors believed that corporate earnings would grow faster in the future. However this is unlikely to continue in the future as corporate earnings are projected to be sluggish.

Source: Will Bonds Outperform Stocks over the Long Run? Not Likely” by Peng Chen, CFA of MorningStar Investment Management and Roger Ibbotson, Ph.D. of Yale School of Management and Ibbotson Associates

Related ETF:

SPDR S&P 500 ETF (SPY)

Disclosure: No Positions
Historical Dividend Yield and Dividend Payout Ratio of S&P 500 Index

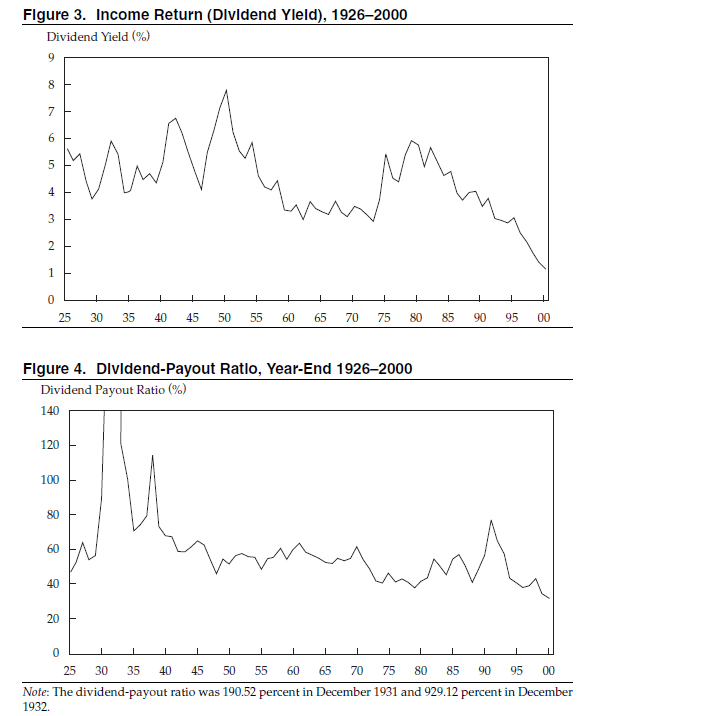
The chart below shows the Dividend Yield and Dividend Payout Ratio of the S&P 500 index 1926 to 2000:

Click to enlarge

The Dividend Yield dropped from 5.15% at the beginning of 1926 to just 1.10% at the end of 2000.

The Dividend Payout Ratio was at 46.68% the beginning of 1926 but decreased to just 31.78% at the end of 2000. The highest dividend payout ratio was in 1932 and the lowest was in 2000.On average the dollar amount of dividends after inflation grew 1.23% a year, while the dividend-payout ratio decreased by 0.51% per year.

Source: Long-Run Stock Returns: participating in the real economy by Roget G.Ibbotson (Professor of Finance, Yale School of Management) and Peng Chen(Ibbotson Associates)

Related ETF:

SPDR S&P 500 ETF (SPY)

Disclosure: No Positions
Forget about Facebook and Buy These 10 Foreign Stocks

In the past few weeks the U.S. media hype into the Facebook IPO went into overdrive.Investors were bombarded with every little bit of information about the company and its young and now wealthy founders.Only Wall Street bankers, company founders, venture capitalists and other investors who acquired shares in the secondary market will make money while the rest of the most retail investors will lose with this IPO. The entire Web 2.0 and the social media industry that is spawning a variety of companies is a simply a fad. Playing games online all day or writing worthless updates on a Facebook wall every two minutes is not productive use of one’s time and definitely does not make our lives better.The general public will eventually decide to ignore these latest hi-tech fads and their over-priced stocks.

Investors are better off to steer clear of all these technology companies that are brought public by Wall Street and yield-hungry venture capitalists.While in the past Silicon Valley venture capitalist firms used to fund high quality innovative companies today the majority of the VC firms’ sole aim to make money the fastest way possible and move on to the next hyped-up startup.

Instead of chasing the latest silly and meaningless ideas like greedy VC firms do, smart investors may want to invest their hard-earned money in companies that actually make products or offer services that helps the society live better. One strategy is to select companies that hold leadership positions in their respective industries.Generally these companies have been around for a long time and strive hard every day to maintain their edge over the competition. While there are thousands of such world-class companies ten are listed below for consideration. As the market continues to take investors on a roller-coaster ride everyday one can add these stocks to their portfolios in a phase manner and hold them for the long-term.

1.Company: BASF AG (BASFY)
Current Dividend Yield: 4.53%
Country: Germany
Investment Rationale: The largest chemical maker in the world.

2.Company: ABB Ltd (ABB)
Current Dividend Yield: 4.20%
Country: Switzerland
Investment Rationale: A leader in power and automation technologies.

3.Company: LaFarge (LFRGY)
Current Dividend Yield: 3.79%
Country: France
Investment Rationale: One of the top cement makers in the world.

4.Company: Linde AG (LNEGY)
Current Dividend Yield: 2.09%
Country: Germany
Investment Rationale: A leading supplier of industrial, process and specialty gases.

5.Company: Nestle SA (NSRGY)
Current Dividend Yield: 3.65%
Country: Switzerland
Investment Rationale: The world’s biggest food company.

6.Company: Autoliv (ALV)
Current Dividend Yield: 3.29%
Country: Sweden
Investment Rationale: One of the top integrated automotive safety system suppliers.

7.Company: Empresa Nacional de Electricidad (EOC)
Current Dividend Yield: 4.10%
Country: Chile
Investment Rationale: One of the largest electricity generating companies in Latin America.

8.Company: Teva Pharmaceuticals Ltd (TEVA)
Current Dividend Yield: 3.06%
Country: Israel
Investment Rationale: The world’s largest generic drugs maker.

9.Company: Diageo (DEO)
Current Dividend Yield: 2.77%
Country: UK
Investment Rationale: The world’s largest spirits maker.

10.Company: Novo Nordisk (NVO)
Current Dividend Yield: 1.74%
Country: Denmark
Investment Rationale: Leading global diabetes care company.

Note: Dividend yields noted are as of May 23, 2012

Disclosure: Long ABB, LFRGY

Can Bonds Outperform Stocks in the Long Run?

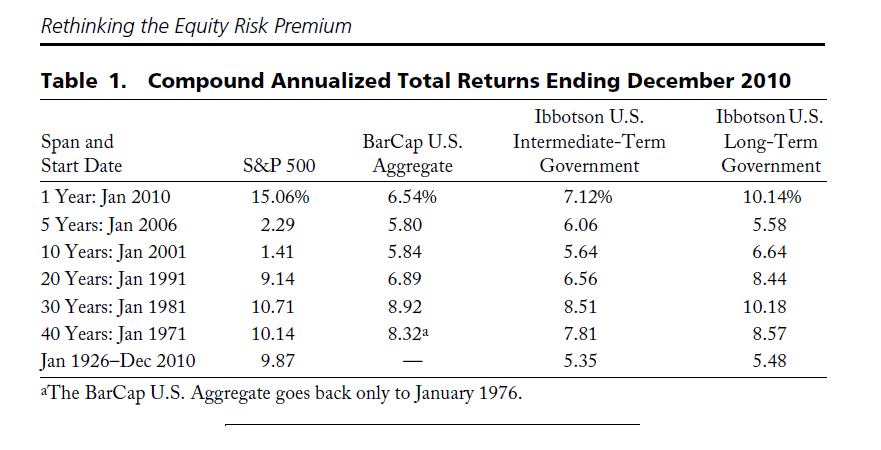
Equity investors often wonder if stocks are better performers than bonds. This question takes on higher importance especially during times of high volatility in equity markets or when the return on equities is negligible or negative. For the decade ending in 2010, U.S. stocks were basically flat as measured by the S&P 500 while bonds yielded decent returns.

I recently came an interesting research report titled “Will Bonds Outperform Stocks over the Long Run? Not Likely” by Peng Chen, CFA of MorningStar Investment Management and Roger Ibbotson, Ph.D. of Yale School of Management and Ibbotson Associates

The following are some of the key takeaways from the report:

1.The table below shows the performance of the S&P 500 Index, the Barclays Capital U.S. Aggregate Bond Index, the Ibbotson U.S. Intermediate-Term Government Bond Index, and the Ibbotson U.S. Long-Term Government Bond Index over various time periods:

Click to enlarge

The average annual stock returns have been poor relative to bonds for the past 10 years and mediocre for the past 20, 30, and even 40 years relative to bonds.

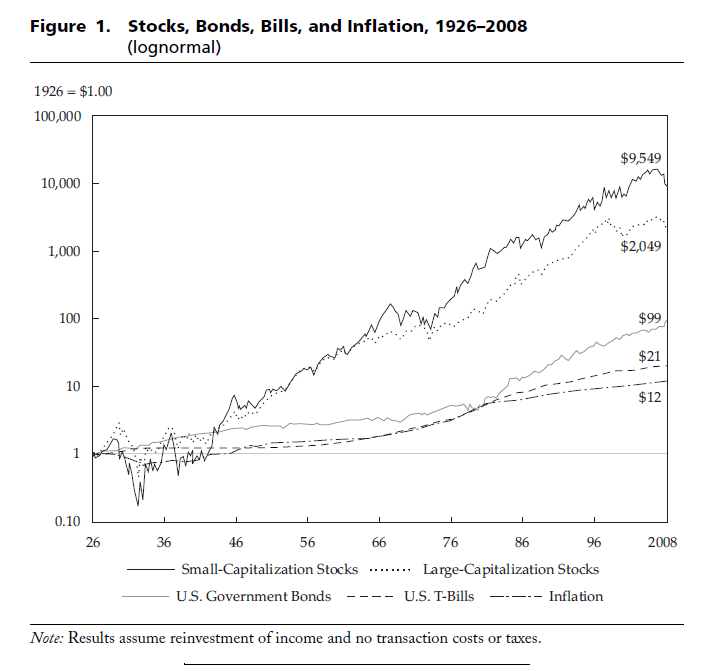
2.Over the very long term however, stocks easily beat bonds. The chart below shows the return of various asset classes over the 85-year period since 1926:

Click to enlarge


3.U.S. stocks’ compounded total returns over other long periods are shown below:

January 1825–December 19251 7.3%
January 1926–December 2010 9.9%
January 1825–December 2010 8.5%

With relatively high returns stocks outperform bonds over long periods.

4.For the 40-yer period from 1971 thru 2010, the majority of the bond returns came from yields and only a small portion from capital gains. In contrast, stocks generated the most return from capital gains and only some of the returns from dividend yields.

5.Given the current low-yield environment projected to continue into the future, it would be almost impossible for bonds to generate the same amount of capital gains as they did in the past.

6.In 2010, the dividend yield on the S&P 500 was 2.03%. If stocks produce an average of even 2% in capital gains per year then the total return of stocks per year will be 4.03%. So one can expect stocks to beat bonds going forward.

7.Stocks tend to outperform bonds over long periods. However stocks are riskier assets compared to bonds even when held for very long time periods.

Source: Will Bonds Outperform Stocks over the Long Run? Not Likely” by Peng Chen, CFA of MorningStar Investment Management and Roger Ibbotson, Ph.D. of Yale School of Management and Ibbotson Associates

Related ETFs:
iShares Lehman TIPS Bond Fund (TIP)
iShares Barclays 20+Year Treasury Bond Fund (TLT)
SPDR S&P 500 ETF (SPY)

Disclosure: No Positions
Why Invest in Chile’s Financial Sector

Chile has one of the top growing economies in Latin America. Though the country’s economy is primarily dependent on exports of commodities such as copper the composition of the GDP is slowly changing.

Today though mining is the major industry in Chile, financial services account for about 16% of the GDP according to a Doing Business in Chile report by KPMG. From a size perspective, the country’s total banking assets is equal to the assets of one large Brazilian bank.

Some of the reasons to invest in Chilean banks/financial sector include:

  • Chileans are big savers with the current savings rate standing at an astonishing 21.6%.
  • The country’s has a mandatory saving system for all dependent employees.
  • Due to the lack of company retirement plans and limited government pensions plans, most Chileans have private pension plans which are managed by five asset management firms.
  • The financial sector also benefits from the Chilean government running a regular budget surplus for the past few years.
  • With the structural changes in the banking sector in 1997 many foreign players have entered the market.
  • Under the constitution, both domestic investors and foreigners have the same equal rights.

The Top 10 Banks in Chile are listed below:

[TABLE=1061]

Source: Doing Business in Chile, KPMG

Founded in 1978, Banco Santander(SAN) is the largest bank in Chile. Banco Santander is a unit of the Santander Group of Spain. The second and third largest banks are Banco de Chile (BCH) and Banco BCI respectively.Corpbanca (BCA) is the Chilean oldest bank.Other foreign-owned banks with strong presence in the country include Banco BBVA (unit of Spain’s BBVA), Scotia Bank(unit of Bank of Nova Scotia of Cananda) and Banco Itau (unit of Itau Unibanco of Brazil).

Investment services provider Administradora de Fondos de Pensiones Provida SA (PVD) also offers an option to invest in Chile’s financial services sector.

Disclosure: Long BCH and BCA