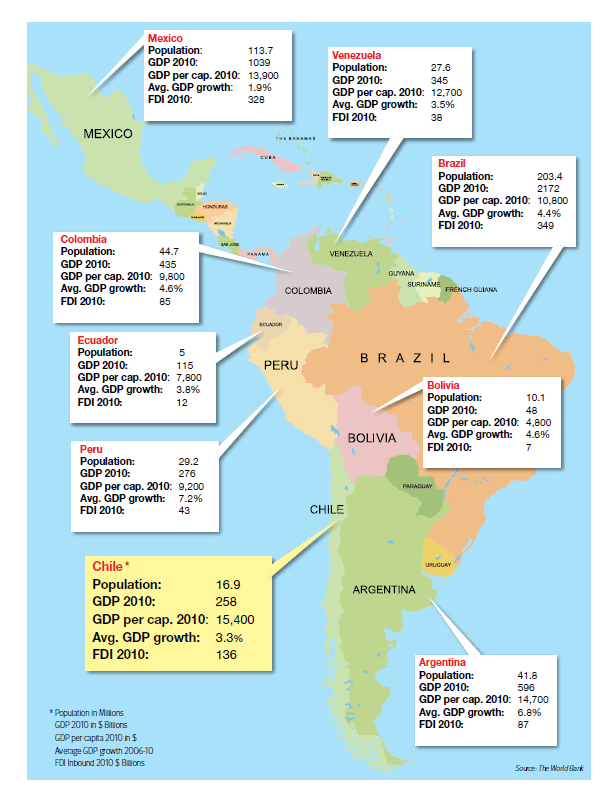
Source: The World Bank
Comparing Dividend Yields of U.S. Equities with Foreign Equities
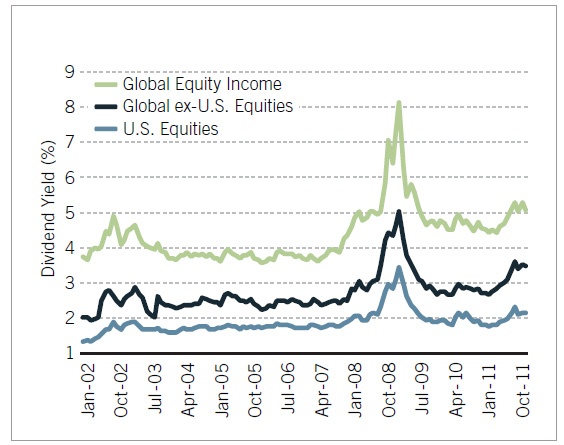
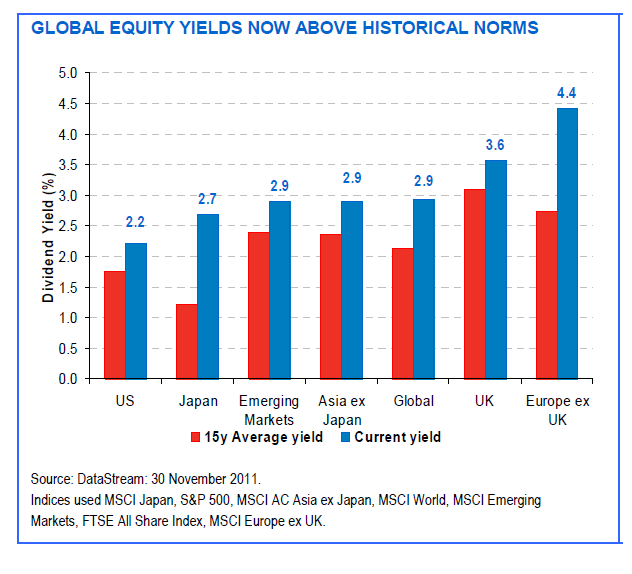
U.S. stocks generally have lower dividend yields than foreign stocks. Compare to the yield of around 2% for the S&P 500 many foreign markets have higher dividend yields. The following charts show the consistent lower yields of U.S. equities.
Chart 1: Dividend Yields of U.S. equities vs. Foreign Equities
Click to enlarge
Chart 2: Historical and Current Dividend Yields of U.S. equities vs. Foreign Equities
Source for Chart 2: The case for equity income investing, Fidelity UK
Related Posts:
On the Dividend Yields of U.S. and Foreign Stocks
Comparison of Dividend Yields Across Major Markets
Related ETFs:
iShares MSCI Emerging Markets Index (EEM)
Vanguard Emerging Markets ETF (VWO)
SPDR S&P 500 ETF (SPY)
SPDR STOXX Europe 50 ETF (FEU)
SPDR DJ Euro STOXX 50 ETF (FEZ)
Disclosure: No Positions
The Top Ten Banks in Chile
Chile has one of the most vibrant and growing economies in Latin America with a GDP of about $203.0 billion in 2010. Though some investors consider the Chilean economy as a commodity-based economy other industries contribute a significant part to the economy. For example, the financial services industry accounted for 16% of the GDP in 2010.
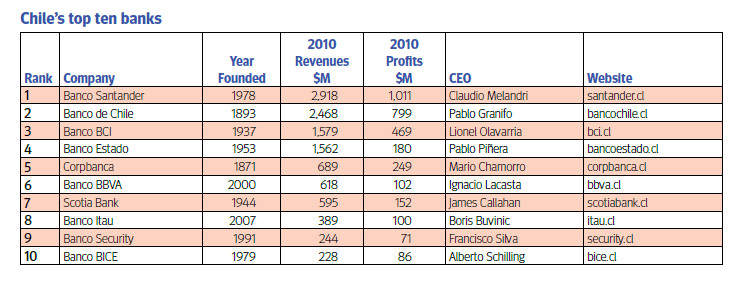
The Top Ten Chilean Banks based on revenues in 2010 are listed below:
Click to enlarge
Source: Doing Business in Chile, KPMG
Among the top banks noted above, Banco de Chile (BCH), Banco Santander (BSAC) and CorpBanca (BCA) trade on the US markets as ADRs. Currently they have dividend yields of 4.47%, 4.01% and 81.9% respectively. For US investors, the Chilean government will deduct a withholding tax of 35.0% from dividend payments.
Note: Dividend yields noted are as of June 1, 2012
Disclosure: Long BCH and BCA
Correation Between the Performance of Commodities and Equities
Commodities are high risk investments that most retail investors should avoid. However in recent years Wall Street has pushed commodities heavily on investors as a “safe” investment with the introduction of ETFs and other tools. Investing in commodities is not a good idea for retail investors as commodities tend to be highly volatile, most of them do not produce a regular income in the form of dividends like stocks, prices vary based on a multitude of factors such as demand and supply, weather, futures markets, etc. Some of the concepts involved in commodities market is not easy to understand for most investors. The concept of “Contango” that heavily impacted the oil market a few years is one such example.
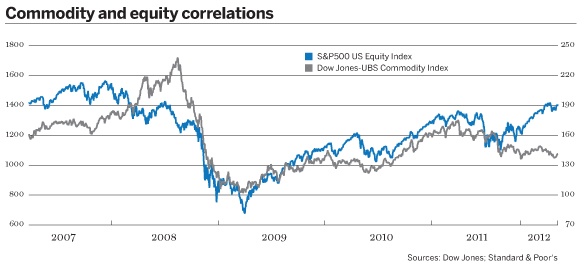
The performance of commodities and equities are usually not correlated. However in the past few years the correlation was strong with commodities and equities following one another. The following chart shows the correlation between commodities and equities since 2007:
Click to enlarge
From Commodity correlation causes headache for investors in The Banker magazine:
The reputation of commodities as a diversification tool has taken a battering of late, as prices have seemingly moved up and down in intractable harmony. However, there is a little agreement over whether high levels of correlation are the new normal, or a symptom of the financial crisis that will fade with time.
Correlation in commodities is manifested in one of two ways – either as price co-movements between individual commodities, or against other asset classes, such as bonds and equities. The recent bout of correlation presented initially within commodities but ultimately mushroomed into high levels of synchronisation across all asset classes.
A key year in the rise of correlations was 2005, when the price of food began to rise rapidly, reversing decades of decline. The price of wheat in January 2006 was $167 a ton, according to the International Monetary Fund. By early 2008, it had spiralled to $481 a ton, sparking riots on the streets of 30 countries.
Related ETFs:
SPDR S&P 500 ETF (SPY)
iShares GSCI Commodity-Indexed Trust (GSG)
United States Commodity Index Fund (USCI)
PowerShares DB Commodity Index Tracking Fund (DBC)
United States Oil Fund LP (USO)
Disclosure: No Positions
Historical P/E Ratio of the S&P 500 Index
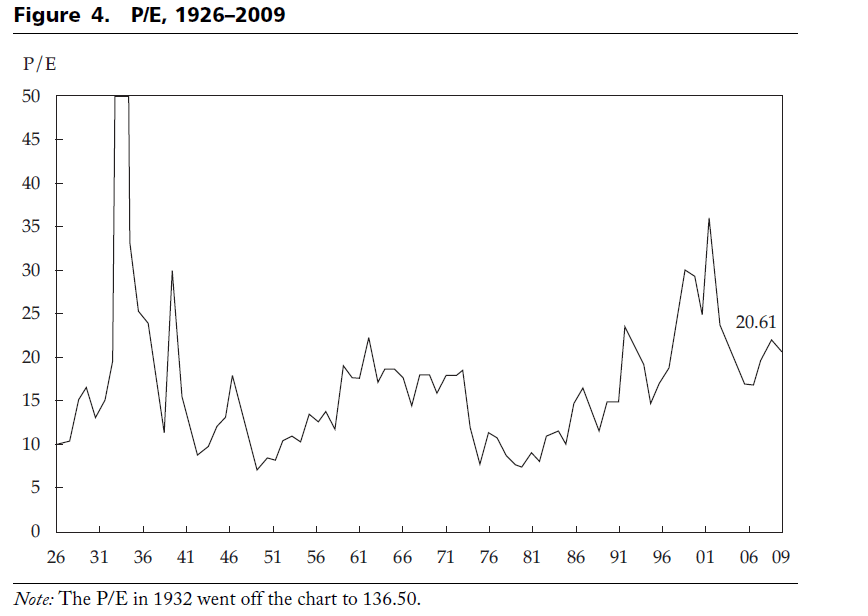
The historical P/E ratio of the S&P 500 1926 to 2009 is shown below:
Click to enlarge
The Price to Earnings (P/E) ratio was at 10.22 in the beginning of 1926 and reached 20.61 in 2009—an average increase of 0.84% per year. The highest P/E ratio was 136.50, recorded during the bull market in 1932, and the lowest was 7.07, recorded in 1948.
The P/E ratio has never gotten to a level less than 5, even through the Great Depression during the 1920s and 1930s and the 2008–09 global financial crisis.
The P/E rose dramatically over the past 80 years because investors believed that corporate earnings would grow faster in the future. However this is unlikely to continue in the future as corporate earnings are projected to be sluggish.
Source: Will Bonds Outperform Stocks over the Long Run? Not Likely” by Peng Chen, CFA of MorningStar Investment Management and Roger Ibbotson, Ph.D. of Yale School of Management and Ibbotson Associates
Related ETF:
SPDR S&P 500 ETF (SPY)
Disclosure: No Positions
