Historical Performance Charts of Select Asian Equity Indices

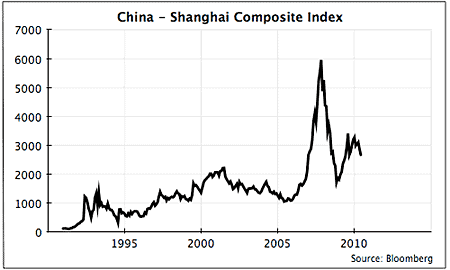
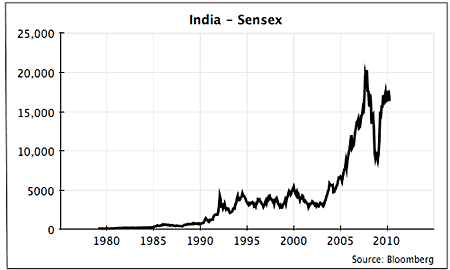
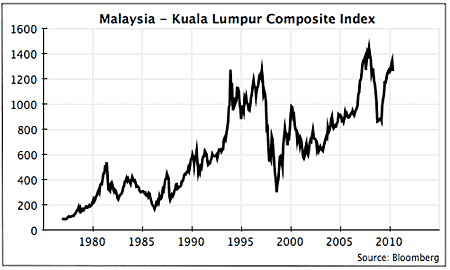
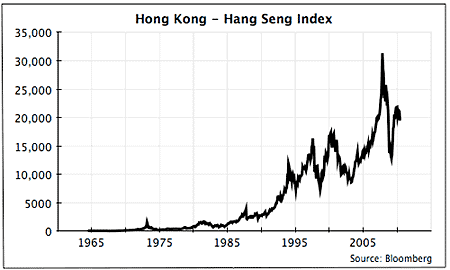
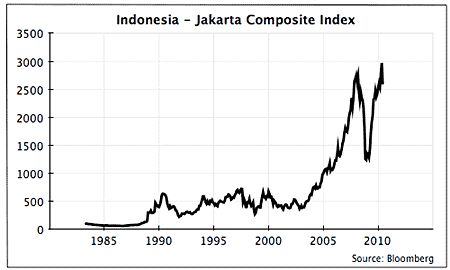
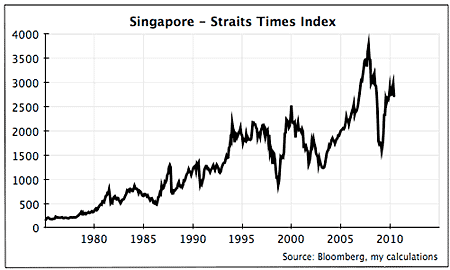
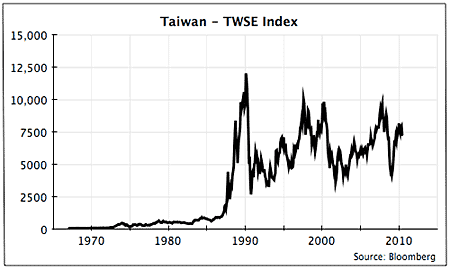
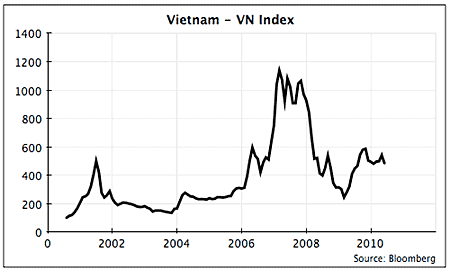
The long-term return charts of many equity markets is not easy to find online. This is especially true in the case of frontier and emerging markets. The following charts show the long-term performance of major equity indices in Asia. The risks with investing in emerging markets is confirmed by dramatic rise and falls of stock indices in China, India, Vietnam, etc.

1. Shanghai Composite Index

Click to enlarge
 

2. Sensex
 

3 Kuala Lumpur Composite Index
 

4. Hang Seng Index
 

5. Jakarta Composite Index
 

6. Straits Times Index


7. TWSE Index
 

8. VN Index
 

Source: MoneyWeek, UK

Some Related ETFs:

iShares MSCI Malaysia Index Fund (EWM)

iShares MSCI Singapore Index Fund (EWS)

iShares FTSE/Xinhua China 25 Index Fund (FXI)

iShares S&P India Nifty 50 (INDY)

iShares MSCI Hong Kong Index Fund (EWH)

Market Vectors Vietnam ETF (VNM)

iShares MSCI Taiwan Index Fund (EWT)

Disclosure: No Positions
External Debt of the G7 Countries

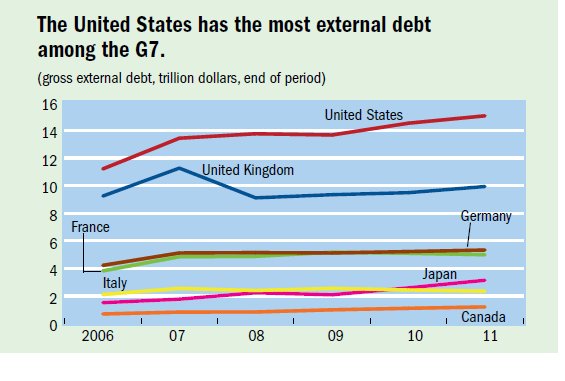
The graph below shows the external debt of the G7 countries:

Click to enlarge

Source: Finance and Development, June 2012, IMF

From the G7 Borrowing from Abroad article in the IMF magazine:

The United States has the most external debt of the world’s richest countries (the Group of Seven major industrial countries, or G7), but as a share of GDP, the United Kingdom tops the list. The gross external debt (that held by foreigners) of the United Kingdom exceeded four times its GDP in 2011, mainly because of its role as an active financial center.France, Germany, and Italy all had ratios over 100 percent.The U.S. external debt—$15 trillion in 2011—was equal to its GDP. That number has risen significantly over the past five years (from $11 trillion in 2006), in part to finance a high fiscal deficit.

U.S. debt as of 8/9/2012 is $15,915,814,457,919.46 according to U.S. Department of Treasury, Bureau of Public Debt. The Gross External Debt was 5264.0 millions (or) $5.2 Trillion at the end of April this year. Out of this amount, China and Japan are the largest foreign holders of US debt of over $1.0 Trillion each.

How Much Do Americans Pay in Insurance Premiums Each Year?

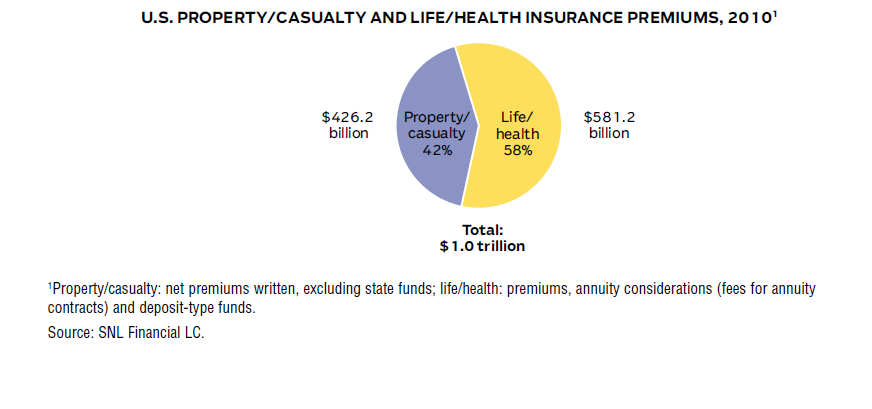
The insurance industry in the U.S. is dividend into Property & Casualty (P&C) and Life/Health Insurance companies. In other countries, the industry is split into life and non-life or general insurance companies.The insurance industry employs over 2.2 million or about 2% of the total U.S. workforce in the private sector .There were about 2,689 P&C companies and 1,061 Life&Health companies in 2010 in the U.S. according to the National Association of Insurance Commissioners (NAIC).

Life and Health insurers employ more workers than P&C insurers. In addition, because health care is expensive and health care costs continue to soar year after year, life and health insurance companies collect more premiums than the P&C companies. In total, Americans pay about a $1.0 Trillion in insurance premiums each year.

The following graph shows the total industry premiums in 2010:

Click to enlarge

Source: 2012 Financial Services Fact Book 2012 by Insurance Information Institute and Financial Services Roundtable.

To put the $1.0 Trillion in perspective, the world insurance premiums (excluding U.S.) stood at $4.34 Trillions in 2010.Life insurance premiums account for a higher portion than non-life premiums worldwide. In fact, in many countries such as France, Germany and Japan people invest a large chunk of their retirement savings in life insurance policies. The U.S. GDP was about $15.0 Trillion in 2011. Since the insurance sector is part of the financial services industry and the financial industry plays a major role in the U.S. economy, the $1.0 Trillion insurance industry premiums is reasonable.

The Safest Banks in North America 2012

The Global Finance magazine published their annual ranking of The Safest Banks in North America for 2012 back in March. From the news release:

The banks were selected through a comparison of the long-term credit ratings and total assets of the largest banks. Ratings from Moody’s, Standard & Poor’s and Fitch were used.

The Safest Banks in North America 2012 are listed below with their current dividend yields:

[TABLE=1063]

Source: Global Finance magazine

Six of the top 10 banks are Canadian banks with all the five major Canadian banks included in this list.Among the U.S. banks, Bank of America (BAC), Citigroup (C) and Wells Fargo (WFC) did not make it to this ranking. Denver, Colorado-based CoBank is a member of the Farm Credit System and is not publicly listed. The Farm Credit System was formed by Congress in 1916 to offer long-term agricultural credit. In January this year, Cobank merged with U.S. AgBank.

Disclosure: Long BNS, BMO,CM, RY, TD and USB

Market Share of the Global Tourism Industry

Tourism is increasingly becoming a major industry for many countries. International travel is growing in many emerging countries due to rising income levels and easier access to travel abroad. Globally, tourism spending totaled US$1.03 trillion in  2011 for increase of 3.8% over 2010 levels. The top three countries in international tourist arrivals ranked in order are France, USA and China in 2011. 79.5 tourists visited France last year which is more than its population of about 65.0 million.  In terms of revenues, the U.S. topped the list with international tourist receipts of just over $116.0 billion.

Here is an interesting chart on the global tourism market share:

Click to enlarge


Source: Le Monde