Six Consumer-Products Multinationals with High Emerging Market Sales

Emerging market economies grew faster than developed world economies for many years now and this trend is projected to continue for the foreseeable future. For example, this year the U.S. economy is estimated to grow by just under 2%. Compared to this low growth rate, the GDPs of Brazil, China and India are forecast to grow by around 3%, 8% and 6% respectively.

One of the key sectors to benefi from the higher economic growth in emerging markets is the consumer-products sector. This is because the rising middle class consumers in these markets yearn for consumer goods such as tooth paste, household cleaning products, health and beauty products, appliances, instant foods, etc. Unlike the saturated markets of developed countries, the consumption culture is in the early stages of explosive growth in emerging countries. Companies that are able to understand the dynamics of these markets and successfully cater to the demands of the consumers are bound to profit from the growth.

Many western multinational consumer-goods firms already have strong presence in emerging markets. In this post let me discuss six such multinationals based on an article in a recent issue of Bloomberg BusinessWeek.

From “In Emerging Markets, Unilever Finds a Passport to Profit” :

From the markets of Southeast Asia to the aisles of American supercenters, that message is spreading. The Anglo-Dutch maker of household staples such as Dove soap and Lipton tea has accelerated its sales growth, new-product development, and presence in emerging markets over the past three years while many of its rivals in the $7 trillion consumer-goods sector, Procter & Gamble (PG) in particular, are struggling amid the prolonged economic downturn. “It’s Unilever’s moment in the sun,” says Harold Thompson, a Deutsche Bank (DB) analyst who has spent a decade following the company, which sells 400 brands in 190 countries.

Unilever’s newfound luster—its sales are growing at more than double the rate of P&G’s—comes courtesy of emerging markets such as Indonesia, which comprise 55 percent of sales, up from just 20 percent in 1990. That’s a higher proportion than at peers like P&G, France’s L’Oréal (OR), Swiss-based Nestlé (NESN), Germany’s Beiersdorf (BEI), and Britain’s Reckitt Benckiser (RB/). In the third quarter, Unilever’s emerging-market sales rose 12.1 percent, its sixth consecutive quarter of double-digit gains.

Click to enlarge

Firms-with-High-Emerging-market-Sales

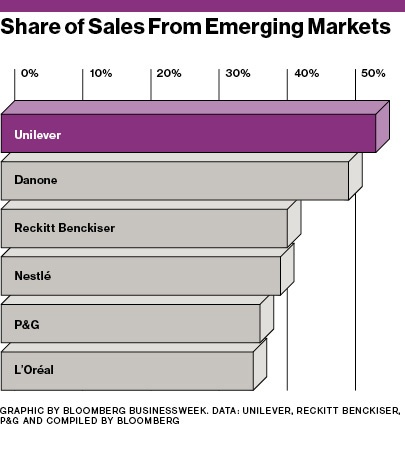
Source: In Emerging Markets, Unilever Finds a Passport to Profit, Bloomberg BusinessWeek

The the tickers on the US markets for the above firms and the current dividend yields are listed below:

1.Company: Unilever PLC (UL)
Current Dividend Yield: 3.11%
Country: UK

2.Company: Unilever NV (UN)
Current Dividend Yield: 3.10%
Country: The Netherlands

3.Company: Danone SA (DANOY)
Current Dividend Yield: 2.54%
Country: France

4.Company: Reckitt Benckiser Group PLC (RBGLY)
Current Dividend Yield: 2.92%
Country: UK

5.Company: Procter & Gamble Co (PG)
Current Dividend Yield: 3.00%
Country: USA

6.Company: L’Oreal SA (LRLCY)
Current Dividend Yield: 1.72%
Country: France

Note: Dividend yields noted are as of Jan 30, 2013

Among the companies note above, Unilever has the highest sales from emerging markets. The company owns more than 400 brands including Lifebuoy, Sunlight, Lipton and Pond’s and 12 of those brands generates sales in excess of €1 billion a year.

Some of the top brands of Danone include Activia and Oikos yougurt, and Evian mineral water.UK-based Reckitt Benckiser Group is the owner of many popular global brands such as Calgon, Air Wick, Dettol, Clearasil, Durex, etc.

For over 140 years Swiss-based Nestle has been a top innovator and maker of high quality consumer products.Nestle’s brand portfolio include well-known brands such as Kitkat, Toll House, Gerber, Milo, NesCafe, etc.The company is also having a strong growth in its water business in China.

Cincinatti,Ohio-based Procter & Gamble Co has 50 leaderships brands which generate 90% of its sales and more than 90% of the profits. Pantene, Mach 3, Scope, Pert, Crest, Ariel, Vicks are some of P&G’s brands.

The cosmetics leader L’Oreal had sales of over €20.3 billion in 2011.The company sells over 27 brands in 130 countries.

Disclosure: Long RBGLY

Five Stocks With Potential for Good Returns


In this post lets take a quick at five stocks from different industries and some of the reasons to own them:

1.Applied Industrial Technologies Inc (AIT)

Applied Industrial celebrated its 90th anniversary this month. Based in the mid-west the company is an industrial distributor selling products including bearings, power transmission components, fluid power components and systems, industrial rubber products, linear motion components, tools, safety products, and general maintenance and mill supply products. Applied has had strong in the past few years and the firm is growing with acquisitions and organic growth.

As a mid-cap company, the stock has performed extremely well in recent years with splits in 2004 and 2006. At current prices, it has a dividend yield of 1.91%.

2. Standard Parking Corp (STAN)

Standard Parking is a parking lot operator in the U.S. and Canada. The company merged with Central Parking, another large competitor   last year and the combined company will have over 2 million parking spaces. In addition to operating parking lots, the company also provides ground transportation services to building owners, hospital,s hotels, etc.

The company currently has a market capitalization of $443.0 million and the stock does not pay a dividend.

3. Equifax Inc (EFX)

Equifax is one of the large credit bureaus offering credit information on consumers and businesses. Though the company has the majority of its businesses in the U.S. the potential to expand overseas is huge. Currently the stock offers a 1.22% dividend yield.

4. UnitedHealth Group Incorporated (UNH

UnitedHealth is one of the largest health insurers in the country. In 2012, the company has revenues of over $110.0 billion. With the new health care laws taking effect slowly, health insurance companies are bound to benefit with millions are uninsured required to buy insurance.

5. Stryker Corporation (SYK)

Stryker manufactures medical devices such as hospital beds and other products including specialty surgical products focused on orthopedics. With sales of over $8.0 billion in 2012, the profit margin is about 15%. The new healthcare law should also help drive earnings higher as the health care will expand to provide services to millions of new consumers.

Note: Dividend yields noted are as of Jan 25, 2013

Disclosure: No Positions

Consumer Staples Stocks Offer Steady Growth and Solid Dividends

The consumer staples sector companies produce products that consumers have to buy regardless of the state of the economy. These products include items like food, personal products, hygiene products, household goods, etc.

Consumer staple companies offer stable dividends with steady growth. They do not grow quickly like tech companies for example. Instead year after year they grow slowly and reward long-term shareholders. Some of the firms have exposure to overseas markets as well which gives them earnings diversification. Adding these stocks to a diversified portfolio offers a “cushion effect” to the portfolio during adverse market conditions.For example, P&G has increased dividends for many years in a row. Colgate-Palmolive has strong presence in overseas markets.

Five consumer staples are listed below:

1.Company: General Mills Inc (GIS)
Current Dividend Yield: 3.16%
Sector: Food Processing

2.Company: ConAgra Foods Inc (CAG)
Current Dividend Yield: 3.09%
Sector: Food Processing

3.Company: Colgate-Palmolive Co (CL)
Current Dividend Yield: 2.25%
Sector: Personal & Household Products

4.Company: Procter & Gamble Co (PG)
Current Dividend Yield: 3.07%
Sector: Personal & Household Products

5.Company: Kimberly-Clark Corp (KMB)
Current Dividend Yield: 3.43%
Sector: Personal & Household Products

Note: Dividend yields noted are as of Jan 25, 2013

Disclosure: No Positions

Ecopetrol Tops Petrobras in Market Capitalization

While most investors have been focused on the fall in Apple’s (AAPL) market capitalization in the past few weeks, another interesting development related to market caps took place today in the world of foreign oil companies. Ecopetrol (EC) of Colombia overtook Brazil’s oil major Petrobras(PBR) in terms of market capitalization despite Petrobras producing three times as much oil and gas, according to a post in FT beyondbrics blog.

The five year performance comparison of the Ecopetrol and Petrobras ADRs is shown below:

Click to enlarge

EC-vs-PBR-5-years

Source: Yahoo Finance

Based on the today’s closing prices in New York, Ecopetrol’s market cap is over $129.1 billion compared to Petrobras’ $127.25 billion.

Ecopetrol’s ADR started trading on the NYSE in September, 2008 and has risen almost consistently ever since. Petrobras’ ADR, on the other hand, was listed on the NYSE in August 2000 and the stock has had 2 for 1 splits in 2007 and 2008. However in the past few years Petrobras’ stock has been performed poorly due to investors’ dissatisfaction with some of the political interference in the company. It will be interesting to watch if Ecopetrol is able to continue the exponential growth.

Disclosure: Long PBR

Does Market Timing Work ?

Market timing generally tend to be suitable for investing in emerging markets which an rise and fall sharply in just a few years or even months. However timing the market in developed country stocks is usually not a wise idea. However here is a chart showing the performance of S&P 5000 since 1997 that may challenge this belief:

Click to enlarge

SP500-Returns-1997-jan-2013


Source: Stocks Confront Painful Past, The Wall Street Journal

Here are a few fascinating facts about the US benchmark indices based on Friday’s closing prices:

  • For the first time since 2007 the S&P 500 closed above 1,500 at 1,502.96.
  • The index has more than doubled from multi-year low in March 2009.
  • The index reached its all-time high of 1,565.15 in October 2007.

Source:  S&P 500 Post Longest Winning Streak Since 2004 on Profits, Bloomberg

Here is a 10-year chart comparing the returns of S&P 500, Dow Jones and NASDAQ:

SP-DowJones-Nasdaq-10-year-Chart

Source: Google Finance

Related ETFs:

  • SPDR S&P 500 ETF (SPY)
  • PowerShares QQQ Trust (QQQQ)

Disclosure: No Positions