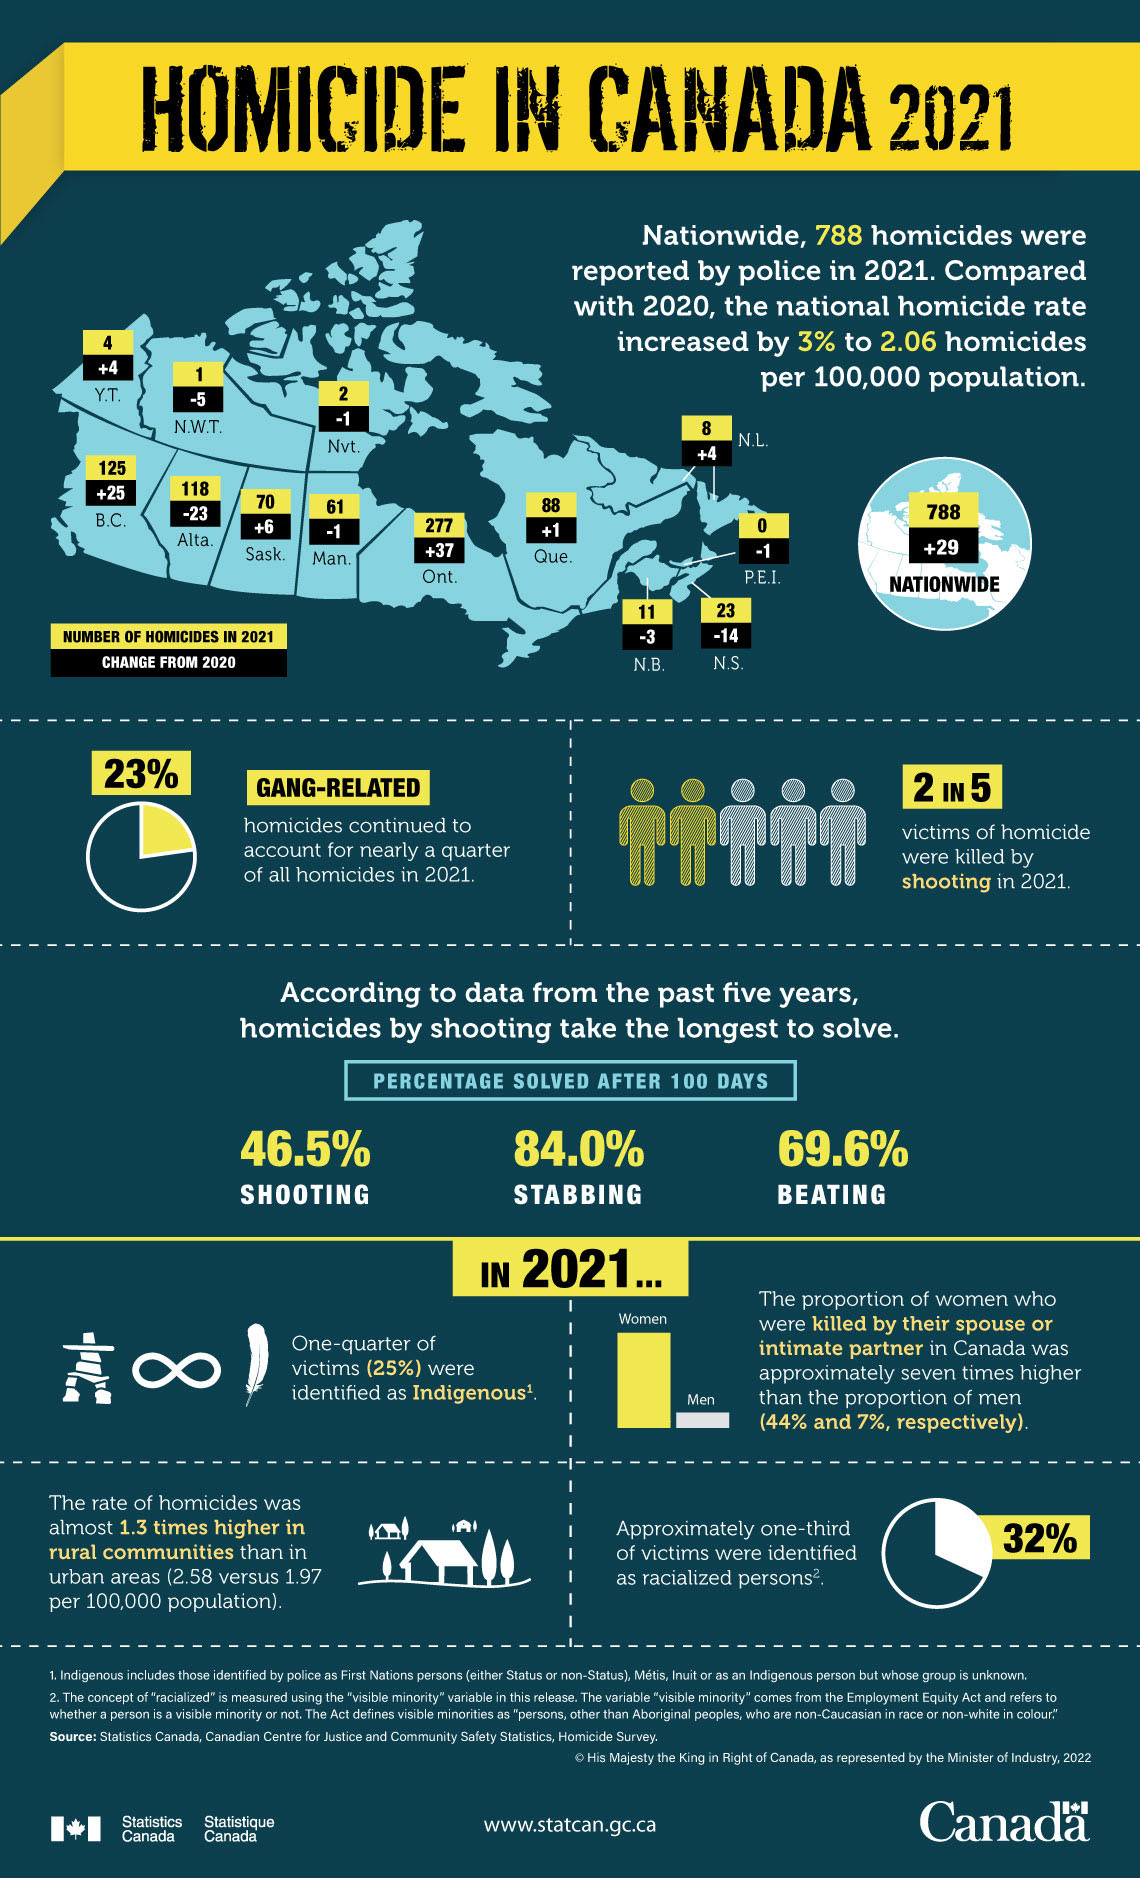
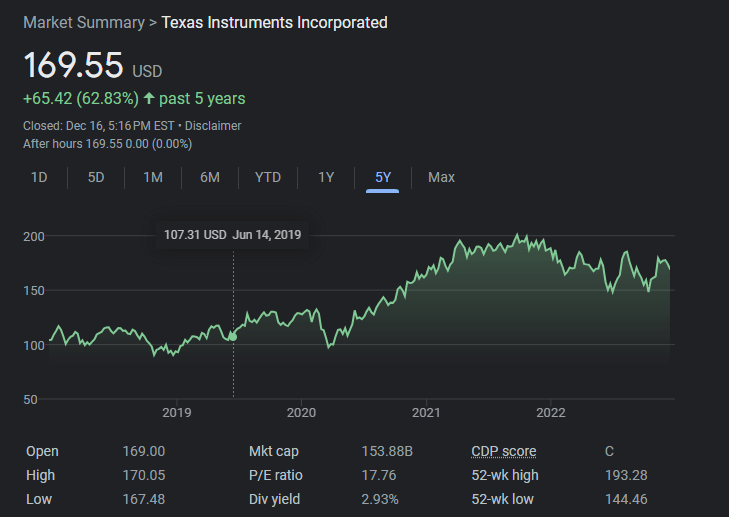
I came across the following infographic on Canadian Citizenship data in 2021. It interesting to note that the US and UK are the top two countries of birth of Canadian citizens by descent. Similarly among Canadian citizens by birth who own dual citizenship are with the US and UK.
Click to enlarge
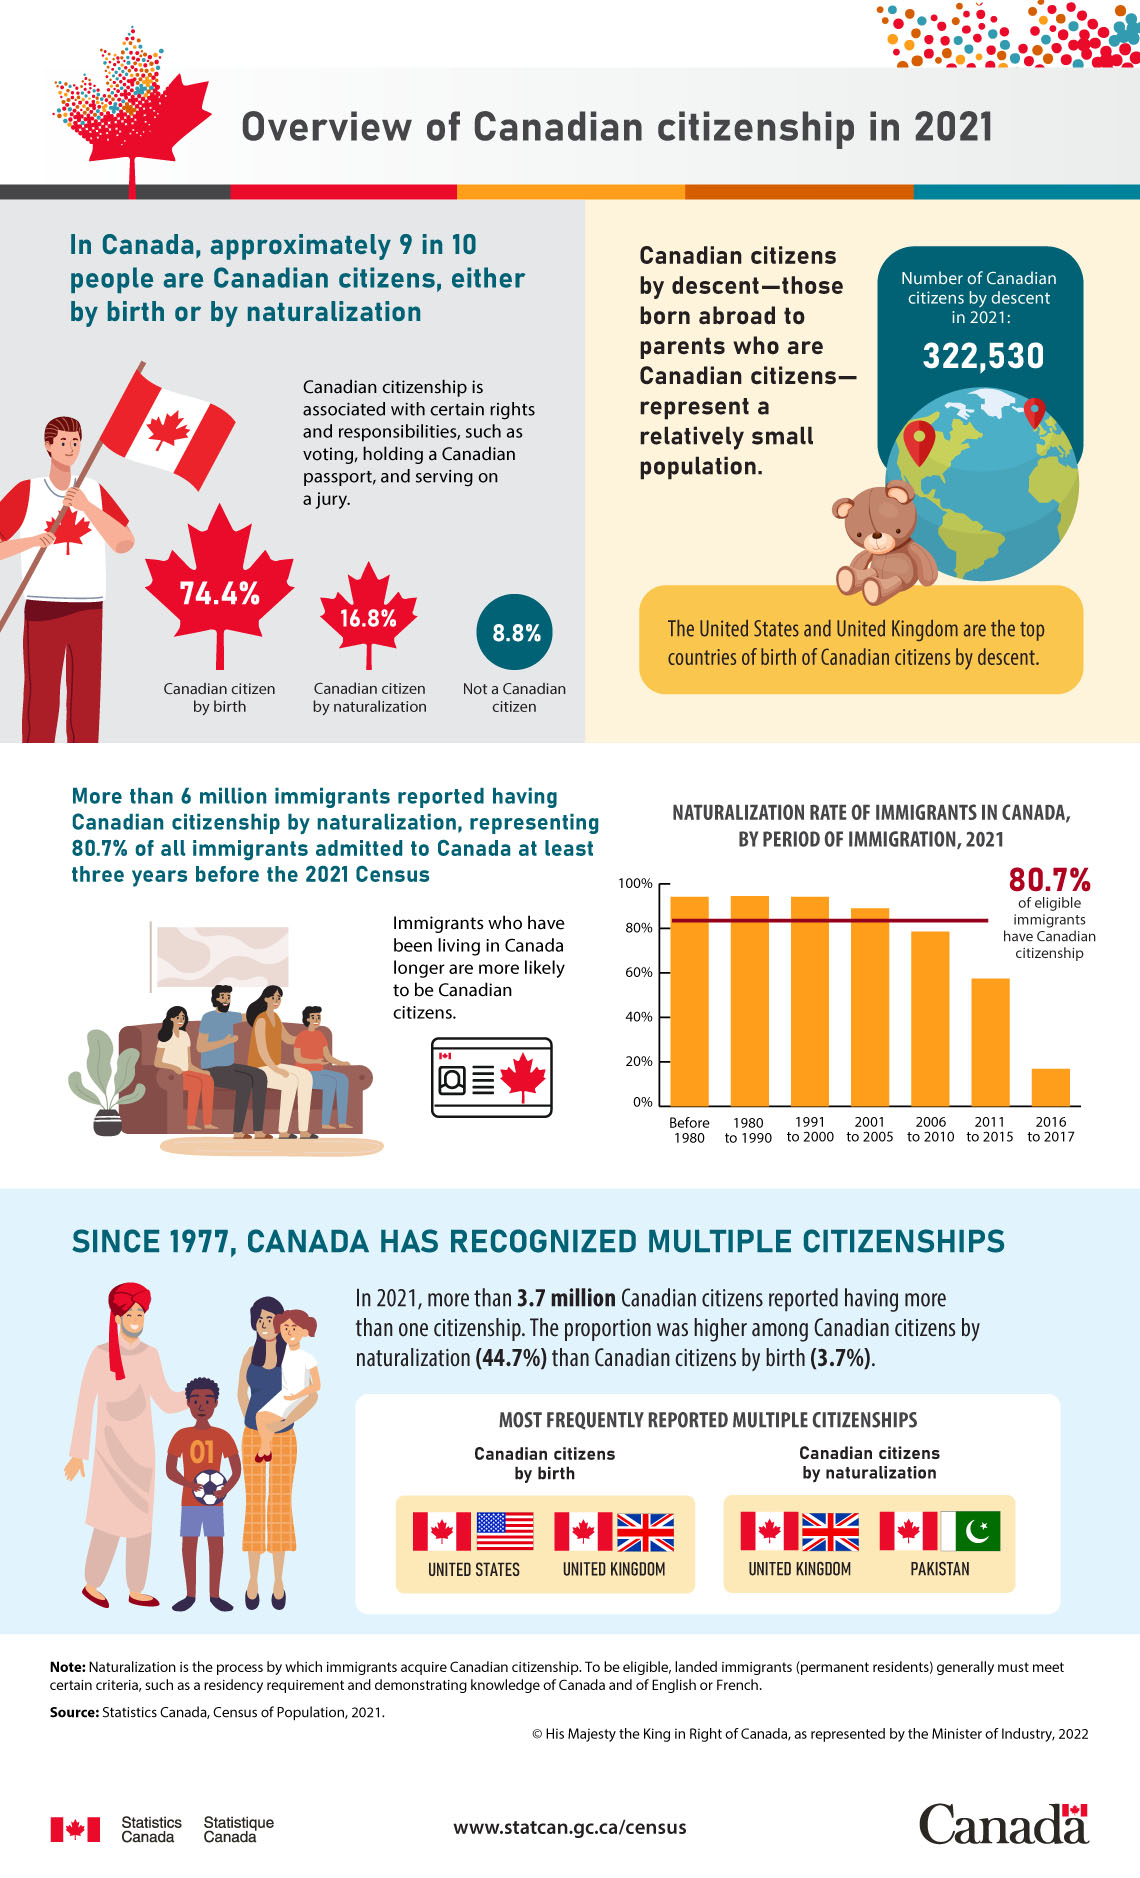
Source: Statscan