The tech industry is not known for many stocks paying a dividend. Accordingly, most investors would not consider the industry when hunting for dividend growth stocks. However there are exceptions. According to an article by Algy Hall at CityWire, semiconductor maker Texas Instruments(TXN) is a winner. The stock has grown its dividend by an astonishing 4,900% in the past two decades thru October 5th of this year. Below is a brief excerpt from the piece:
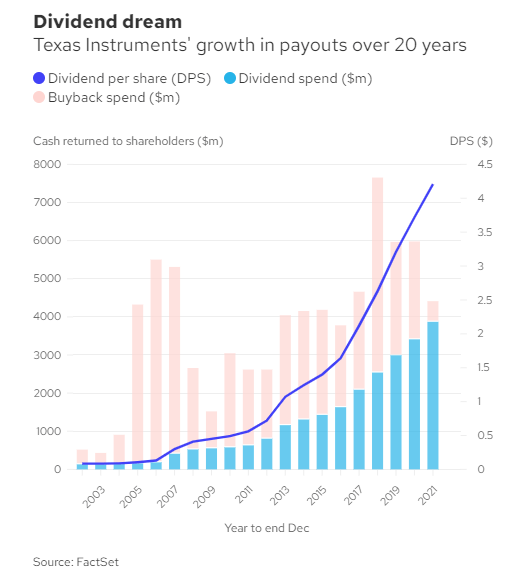
For semiconductor maker Texas Instruments (US:TXN), returning cash to shareholders has become a source of immense pride. It’s easy to understand why.
Over the past two decades, the company has grown its dividend by an incredible 4,853%, from 8.5 cents a share in 2002 to $4.21 last year. The payout has risen in each of the last 18 years, helped by plentiful buybacks which have nearly halved the share count over the same period.
Source: The tech stock that’s grown its dividend 4,900% in two decades, CityWire
One of the products that helps the company rack in millions of dollars each year is the good old analog calculator specifically the TI-84 graphing calculator that is used by high school students. Despite hardly any changes in its features in the past 10 years, the TI-84 was the top selling calculator according to an article at The Washington Post back in 2014. Currently the calculator sells for over $100 a pop.
Texas Instruments currently has a marker cap of $154 billion. The stock closed at $169.55 on Friday and has an annual dividend yield of 2.93%. Though the company has reduced the number of outstanding shares, its still has 907 million of shares outstanding. A $10K investment would have grown to $20,315 by Dec 10th, 2022 according to S&P.
The stock price has declined by 11% year-to-date. In the last 5 years it has increased by 63% as shown in the chart below:
Click to enlarge
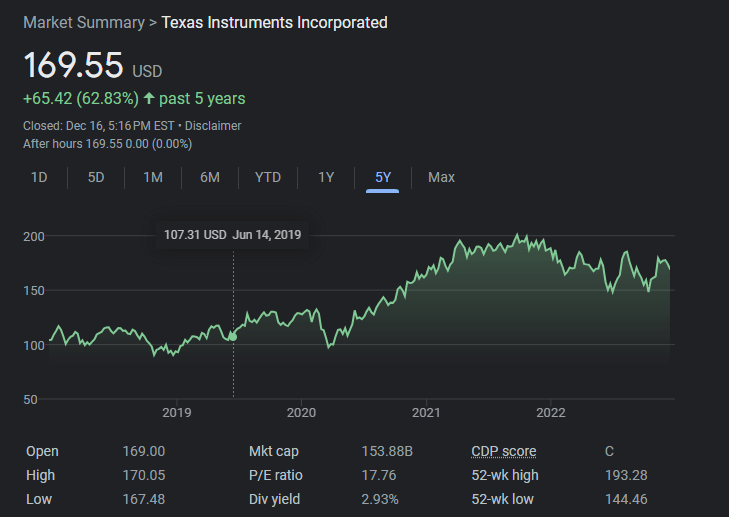
Source: Google Finance
The following chart shows the long-term return of the stock:
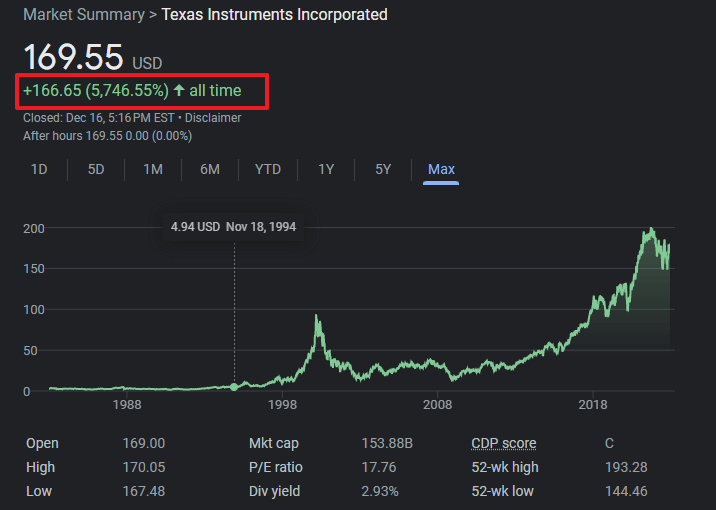
Source: Google Finance
We are not out of the current bear market yet. So investors looking to enter the semiconductor industry may want to keep an eye out for Texan Instruments.
Disclosure: No positions