Review: The Callan Periodic Table of Investment Returns 1994-2013

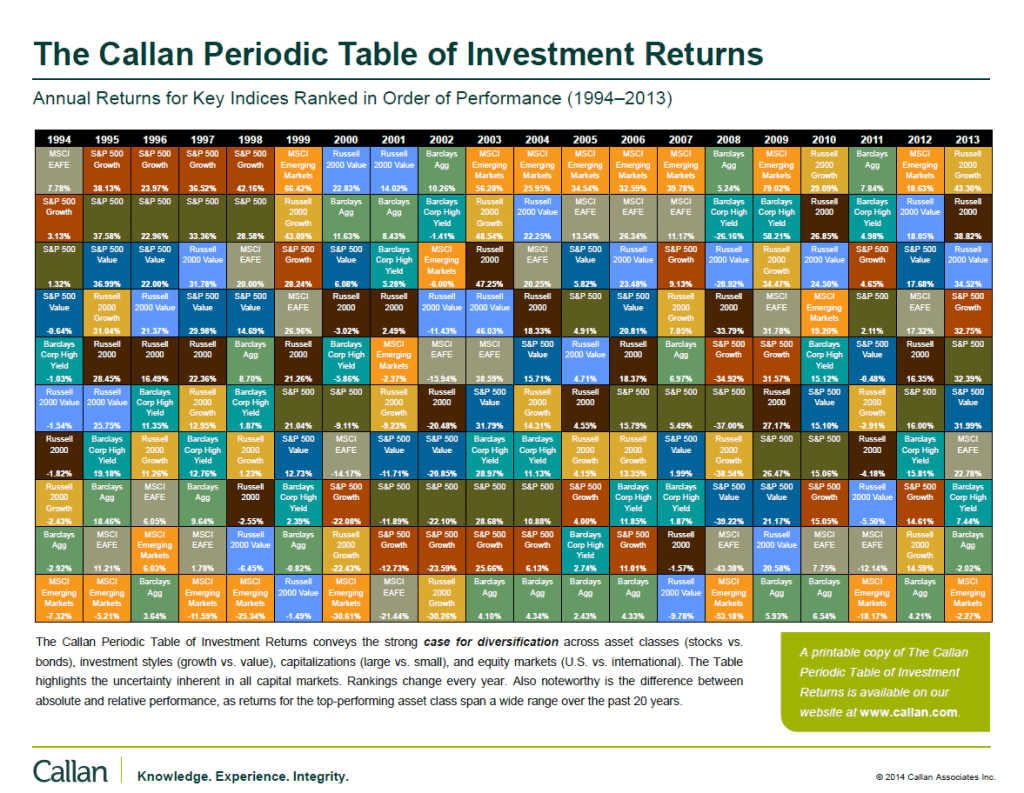
Every year Callan Associates publishes their famous The Callan Periodic Table of Investment Returns. Recently they updated the table with data for 2013.

The Callan Periodic Table of Investment Returns for 2013 is shown below:

Click to enlarge


Callan Period Table of Investment Returns 1994-2013

Source: Callan Associates

As always this chart makes it clear that diversification among asset classes is important. For example emerging markets as a whole lost over 2% last year as measured by the MSCI index while the S&P 500 yielded a total return 32.39%. The difference in returns between these markets is incredible. So anyone who was overweight in emerging markets last year may have not had the best returns possible. Another point to note is that investing in emerging markets than developed markets since they can turn almost overnight for a variety of reasons. Emerging markets were hot a few years ago(2003 to 2007 and 2009, 2012) but that’s not the case nowadays as their performance was poor last year. These markets are still continuing their downward trend this year.

Small caps performed better that large caps with the Russell 2000 growth stocks soaring over 43% relative to S&P 500’s 32%.

Related ETFs:

  • iShares Dow Jones Select Dividend ETF (DVY)
  • SPDR S&P Dividend ETF (SDY)
  • Vanguard Dividend Appreciation ETF (VIG)
  • SPDR S&P 400 Mid Cap Growth ETF (MDYG)
  • iShares Russell Midcap Index Fund (IWR)
  • iShares MSCI Emerging Markets Indx (EEM)
  • Vanguard Emerging Markets ETF (VWO)
  • SPDR S&P 500 ETF (SPY)
  • SPDR STOXX Europe 50 ETF (FEU)

Disclosure: No Positions

You may also want to checkout the Callan Table for 2012, 2011 and 2010.

Download: The Callan Periodic Table of Investment Returns 1994-2013 (in pdf)

Download: The Callan Periodic Table of Investment Returns 1985-2004 (in pdf)

Related: The Callan Periodic Table of Investment Returns 2016: A Review
The Top 10 African Banks By Profit

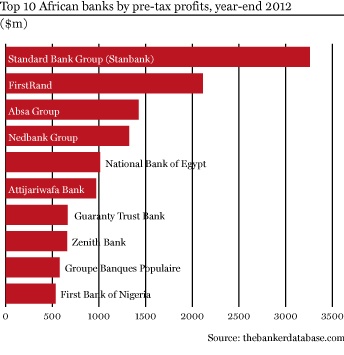
The chart below shows the Top 10 African Banks by Profit:

Click to enlarge

Top-African-banks-by-pre-tax-profit

Source: The Banker

The list is dominated by South African banks which take the top four spots. Standard Bank Group (SGBLY) has presence in 19 countries in Africa and is one of the largest banks in South Africa. Currently the ADR pays a 4.47% dividend yield and the stock price is close to the 52-week low at $11. Nedbank Group Ltd(NDBKY) also has a high dividend yield with a yield of 4.65%. FirstRand trades under the ticker FANDY.

National Bank of Egypt is State-owned. Attijariwafa Bank and Groupe Banques Popul are Moroccan banks with rest of the banks in the list from Nigeria.

Related ETF:

  • iShares MSCI South Africa Index (EZA)

Disclosure: No Positions

The World’s Top Sugar Producers

Sugar comes from two types of crops: cane sugar and beet sugar. Some countries such as the U.S. and China growth both types of sugars. Many countries that produce sugar offer subsidies to their sugar farmers and protect their sugar industry from foreign competition. Some of the laws include the US Farm Act, the European Union Sugar Regime and strict control on imports by the Chinese government.

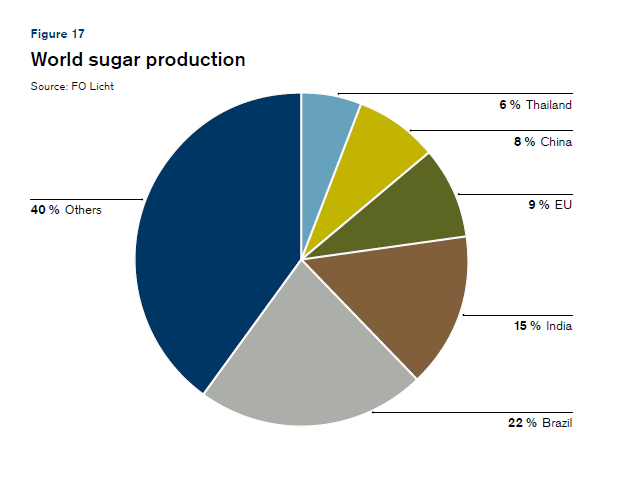
The chart below shows the major sugar producing countries:

Click to enlarge

World Sugar Production

Source: Sugar – Consumption at a crossroads, Credit Suisse

Brazil is the world’s largest sugar producer followed by India and China. With excess sugar production Brazil converts some of them into ethanol which is used as a fuel replacing gasoline. The country is also the world’s largest exporter to the world market. China and India consume all the sugar produced. Hence the supply of sugar to the global market is dominated by Brazil and Thailand.

How Does Inflation Impact Stock Returns

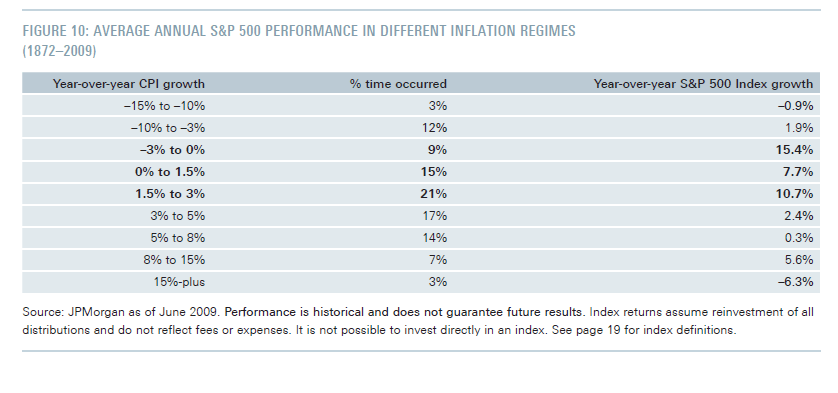
One of the reasons for investing in stocks including dividend-paying stocks is earn a return that keeps up with or even beats inflation. Historically stocks have performed well when inflation, as measured by the Consumer Price Index (CPI) ranged from -3% to 3% according to a white paper published by DWS Investments of Deutsche Bank Group in 2012.

Click to enlarge

SP500 Returns in Inflation Times

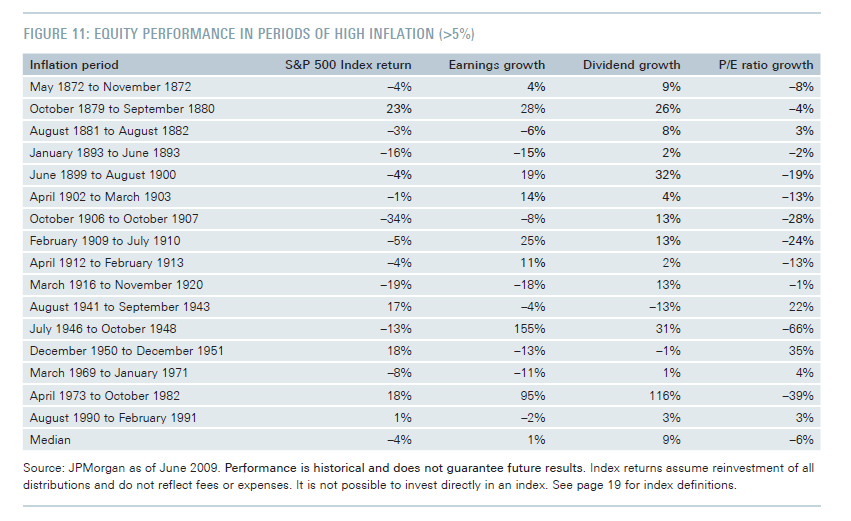
During periods of high inflation, equities tend to perform poorly due to the compression of P/E ratios as shown in the table below:

SP500 Returns inHigh Inflation Times

Source: Dividends: the case for income-oriented investors, DWS Investments

Dividends tend to grow more than equity prices during inflationary periods. In fact, dividends continued to grow even during periods of high inflation (> 5%). During the high inflation period of April 1973 to October 1982 dividend growth was significantly higher than prices.

The key takeaway from this article is dividend stocks are a good asset class to own during periods of moderate and high inflation.

Related ETFs:

  • SPDR S&P 500 ETF (SPY)
  • iShares Dow Jones Select Dividend ETF (DVY)
  • SPDR S&P Dividend ETF (SDY)
  • Vanguard Dividend Appreciation ETF (VIG)
  • SPDR Consumer Staples Select Sector Fund (XLP)
  • SPDR Utilities Select Sector Fund (XLU)

Disclosure: No Positions

Consider Recycling Money From US Stocks Into Canada and Europe

U.S. stocks had a great run in 2013 with the S&P 500 index returning 30%. Most of the S&P sectoral indices including the financials performed very well. After such strong gains, the general consensus among professional money managers now is that equity returns will be good but not great this year. Any investors would agree that the probability of S&P 500 soaring again by 30% or so is highly unlikely. Since undervalued opportunities exist abroad, investors holding gains in U.S. stocks may want to consider booking profits and switching into equities of other developed markets such as those in Canada and Europe.

Canadian stocks had a lackluster performance last year and are relatively attractive at current levels. For example, many Canadian firms are bound to benefit from the U.S. recovery and their stocks have more room to run. Macro economic factors such as housing, trade, investments, exports, etc. are also showing signs of improvement. In addition, CIBC’s Peter Buchanan discussed two factors in a recent research report that are favorable to Canadian stocks.

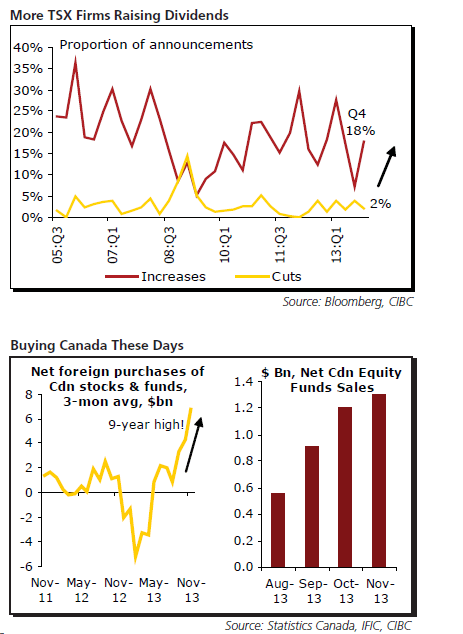
More TSX firms are raising  dividend payments nowadays. About 18% of all dividend announcements in Q4 showed firms increased their payouts with banking, consumer durables/apparel and retailers leading the way.The second factor is that foreigners are pouring money into Canadian stocks since the Canadian equity market is a better play on the global economy than the domestic economy. So these investors are betting to ride the global economic recovery via Canadian stocks.

Click to enlarge

Canada TSX Dividends and Stocks Buy

Source: THE WEEK AHEAD, January 20-24, 2014, CIBC World Markets

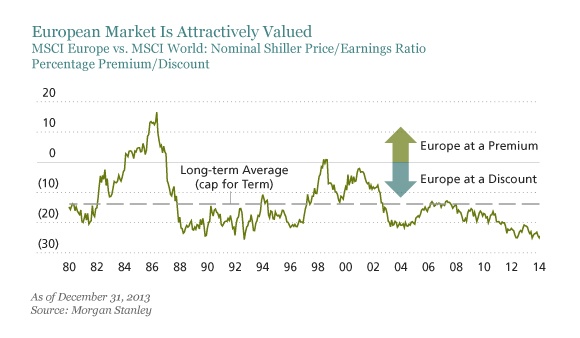
According to Michele Patri of AllianceBernstein, European stocks “offer compelling long-term return potential” now. Though there are short-term uncertainties and real risks in the horizon he notes that European stocks are trading at a significant discount to global stocks as shown in the chart below:

Click to enlarge

European-Stocks-Attractively-Valued

Source: European Equities: In the Market with an Airbag, AllianceBernstein

Ten stocks from Canada and Europe are listed below with their current dividend yields for consideration. I have included five of the major Canadian banks since I believe they offer excellent growth potential for both dividends and price over the long-term.

1.Company: Bank of Nova Scotia (BNS)
Current Dividend Yield: 3.89%
Sector: Banking
Country: Canada

2.Company: Bank of Montreal (BMO)
Current Dividend Yield: 4.19%
Sector: Banking
Country: Canada

3.Company: Canadian Imperial Bank of Commerce (CM)
Current Dividend Yield: 4.33%
Sector: Banking
Country: Canada

4.Company: Royal Bank of Canada (RY)
Current Dividend Yield: 3.73%
Sector: Banking
Country: Canada

5.Company: Toronto-Dominion Bank (TD)
Current Dividend Yield: 3.51%
Sector: Banking
Country: Canada

6.Company: Nestle SA (NSRGY)
Current Dividend Yield: 2.91%
Sector: Food Products
Country: Switzerland

7.Company: Henkel AG & Co KGaA (HENKY)
Current Dividend Yield: 1.19%
Sector: Household Products
Country: Germany

Henkel has raised future dividend payout ratio to be between 25 and 35% from the current 25%. For the fiscal year 2013, a dividend payout ratio of around 30% will be proposed to shareholders at the company’s Annual General Meeting on April 4, 2014.

8.Company: Edp Energias De Portugal SA (EDPFY)
Current Dividend Yield: 4.00%
Sector: Electric Utilities
Country: Portugal

9.Company: Nordea Bank AB (NRBAY)
Current Dividend Yield: 3.14%
Sector: Banking
Country: Sweden

10.Company:Telenor ASA (TELNY)
Current Dividend Yield: 4.35%
Sector: Telecom
Country: Norway

Note: Dividend yields noted above are as of Jan 21, 2014. Data is known to be accurate from sources used.Please use your own due diligence before making any investment decisions.

Disclosure: Long BNS,BMO,CM,RY,TD and HENKY