Caution Warranted on Frontier Markets

Frontier market stocks have soared so far this year. Compared to emerging and developed markets the performance of frontier market stocks is exceptionally good year-to-date(YTD). As of Aug 6th, the MSCI Frontier Market Index increased by 19% YTD while the MSCI indices for Emerging and Developed Markets were up by only 6% and 2.2% respectively.

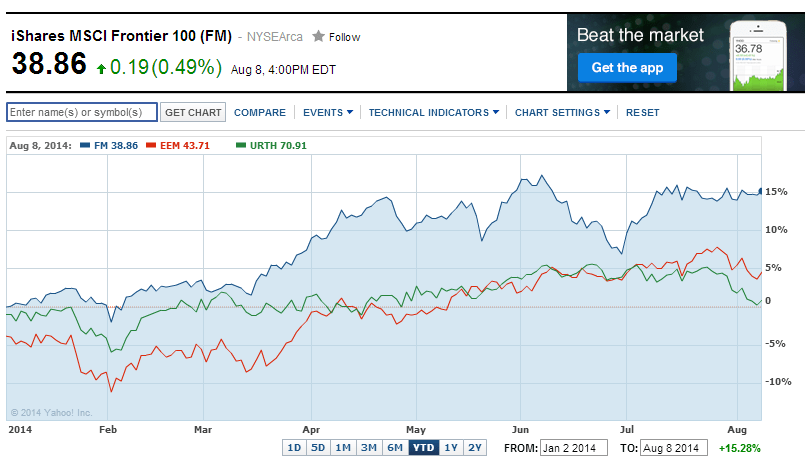
The chart below shows the performance of three iShares ETFs which can be considered as proxies for these markets:

Click to enlarge

Frontier-Emerging-Devloped ETFs YTD

Source: Yahoo Finance

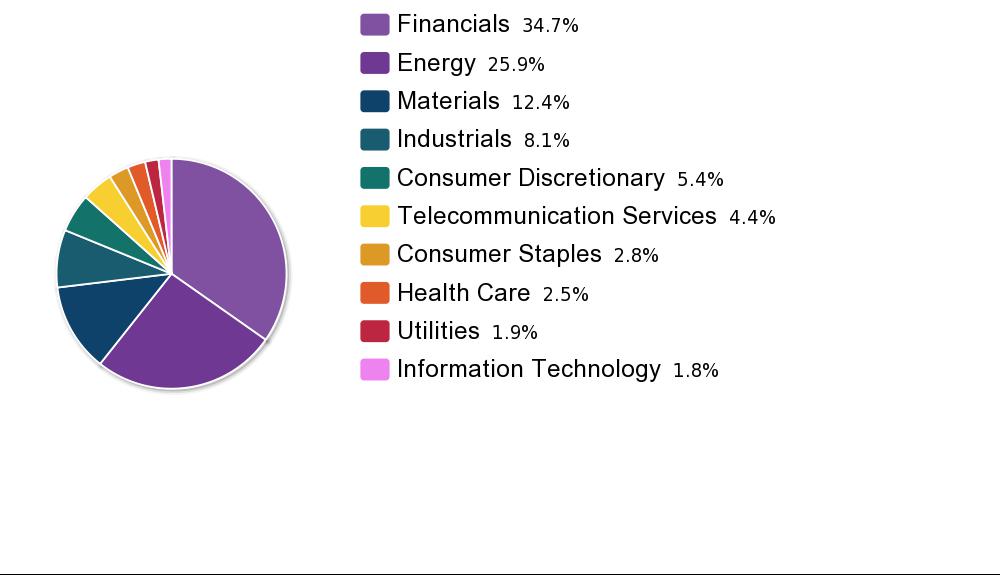
The iShares MSCI Frontier 100 ETF (FM)shown in in blue above tracks the performance of the  MSCI Frontier Markets 100 Index. This index  is comprised of the 100 of the largest and most liquid constituents of the  MSCI Frontier Markets index. Last year the MSCI Frontier Markets 100 Index was up by over 26%.  In terms of country breakdown, Argentina, Kuwait,Nigeria,Qatar and UAE account for about 70% of this index. Financials amount to nearly 55% of the sector weightings in the index. The iShares Emerging markets ETF (EEM) and the iShares MSCI World ETF(URTH) are shown in red and green respectively.

On the individual country level many of the equity markets are up by double digits YTD. The YTD returns of some of the frontier markets are listed below:

Argentina: 52.6%
Egypt: 34.9%
Sri Lanka: 17.0%
Pakistan: 16.3%
Thailand: 17.1%

Source: The Wall Street Journal

From a recent article in the journal:

The attraction to these rapidly growing markets has been widespread. In June, Norway’s $886 billion sovereign-wealth fund, the largest in the world, jumped on the bandwagon toadd frontier markets to its investments.

The problem for many investors is that the opportunities in frontier markets are few and competition is fierce. Foreign ownership of many companies in the index has reached government limits already.

Ten stocks account for more than 35% of the MSCI Frontier index, according to MSCI data, and companies in Kuwait constitute nearly one-quarter of the overall index’s market capitalization. Nigeria accounts for one-fifth.

The total market capitalization of all stocks included in the MSCI Frontier Markets index is $109 billion, according to MSCI, compared with $4 trillion in the equivalent emerging-market index. Given the markets’ size, some investors worry about a potential, sudden race for the exits. With thin liquidity, executing sales quickly could drive frontier markets sharply lower, if buyers could be found at all, they say.

Fund managers say part of the reason frontier markets appear to have performed so well this year that some countries have been reclassified. Qatar and the United Arab Emirates were considered strong enough to be upgraded to emerging status in June, shrinking the realm of frontier markets and concentrating the flow of foreign cash into fewer countries.

Source: Frontier Boom Pushes Boundaries, Aug 7, 2014, The Wall Street Journal

Index provider MSCI upgraded Qatar and the United Arab Emirates to emerging market status as of May 30. So moving forward these countries will be removed from ETFs that mirror the MSCI index.

Despite the dramatic of frontier market equities investors need to be cautious about investing in these markets. Some of the risks of frontier markets include:

  • Political risk is a major factor in these countries. Political chaos and changes can occur almost overnight. During the 2011 revolution in Egypt, the benchmark index plunged and the market was closed for 8 weeks.
  • Stocks in frontier market exchanges can be highly illiquid. Very few percentage of the population participates in the equity market and hence trading volumes may be very tiny compared to the developed world markets. In times of market meltdowns there may not be a way out even if ones to sell their holdings.
  • Frontier markets in general are small in terms of market capitalization relative to emerging and developed markets. For example,
  • the total market capitalization of Vietnam’s stock market reached about $52.0 billion last month. This figure may be high for a country like Vietnam, but the market capitalization of many developed market exchanges are in the billions or even Trillions. The market capitalization of all stocks listed on the New York Stock Exchange exceeded 17.0 Trllions at the end of this year according to the World Federation of Exchanges.
  • Foreign investor participation in such markets is a double-edged sword. Because of high foreign investment these markets can soar but they can also fall hard when they pull out their investments. Since these markets are small a sudden flow of foreign capital can lead to major falls in equity prices.

Frontier markets, as the name implies, is still the wild west of the investing world. Hence investors should only allocate a tiny portion of their portfolio to such markets. In addition, it is better to invest in individual companies. Any investments should be made via an ETF or a mutual fund.

Disclosure: No Positions

The Ten Largest Indian Companies By Market Capitalization

In this post lets take a quick look at the Ten Largest Indian Companies by Market Capitalization in the domestic market. Before we get to that here is a note on the Sensex.

India’s benchmark S&P BSE Sensex index is up 21.25% year-to-date. After reaching an all-time record of over 26,300 the Sensex closed at 25,329 yesterday.

The five year chart of the Sensex is shown in the chart below:

Click to enlarge

Sensex 5-years

Source: Yahoo Finance

With the euphoria over elections over it would be interesting to watch if the Sensex can recover from its recent fall and rise further.


The Ten Largest Indian Companies by Market Capitalization are listed below:

S.No.CompanyMarket Capitalization (in Millions of Indian Rupees)
1TATA CONSULTANCY SERVICES LTD.4,849,810.50
2OIL AND NATURAL GAS CORPORATION LTD.3,372,146.40
3RELIANCE INDUSTRIES LTD.3,170,526.00
4ITC LTD.2,774,202.20
5COAL INDIA LTD.2,241,677.70
6INFOSYS LTD.1,998,542.80
7HDFC BANK LTD.1,919,843.10
8STATE BANK OF INDIA1,803,160.70
9ICICI BANK LTD.1,662,177.80
10HOUSING DEVELOPMENT FINANCE CORP.LTD.1,608,075.50


Source: Bombay Stock Exchange

Tata Consultancy Services (TCS) became the most valuable Indian company on July 23rd reaching a market capitalization of about $84.0 and became the second largest IT company in the world after IBM. It is not surprising to see TCS rise to such astronomical levels since outsourcing of IT services continues as multinationals try to reduce expenses further. The second most valuable company is the state-owned petroleum company Oil and Natural Gas Corporation Ltd (ONGC). Infosys (INFY) another major IT services provider is also in the list underscoring the growth of offshoring and investors’ attraction towards this sector.

Two of the banks in the above ranking – HDFC Bank Ltd (HDB) and ICICI Bank Ltd (IBN) – trade on the New York Stock Exchange. HDFC Bank is an arm of the Housing Development Finance Corp Ltd. In addition to ONGC, State Bank of India and Coal India are two other state-owned companies that are considered most valuable.

ETFs: The Complete List of India ETFs and ETNs Trading on the US Markets

Disclosure: No Positions

What To Do When an ADR is Delisted from NYSE or NASDAQ

One of the issues that investors in NYSE/NASDAQ-listed foreign stocks face is what to do when a company decides to delist from any of these two exchanges. In this post let us discuss some of the options available to deal with this issue:

Why do foreign companies delist from exchanges?

There are many reasons a company can decide to delist. Three of the main reasons are:

1. Lack of trading volumes

US investors may not show enough interest in a foreign company listed on exchanges here. As a result the daily trading volume may be thin. It is not unusual to have trading volumes in the low thousands or even hundreds of shares per day for such stocks. So a company may decide to discontinue listing.

2.High listing fees charged by exchanges 

The listing fees charged by NYSE or NASDAQ can run into thousands of dollars. Some companies may find that expense unjustified especially if there is lack of trading volumes. For example, $20,0000 listing fees per year to NYSE may not be worth it if there is hardly any investor interest in the stock.

3.High costs involved in SEC reporting

Overseas companies listed on the US exchanges have to follow the Security and Exchange Commission(SEC)’s regulations and file reports to them periodically. This involves additional work on their accounting and investor relations departments. Some companies may not want to spend on the added resources and deal with the reporting burden.

 What are the options available when a foreign stock delists from an exchange?

A couple of options to deal with this situation are discussed below.

1. Company delists its stock from the NYSE or NASDAQ and moves it to the OTC market:
Sometimes a foreign company may decide to delist from the organized exchanges and move to the OTC markets for any of the reasons mentioned above or some other reason. The company may continue to sponsor the ADR program. So trading will continue but just the venue will be different.

In such cases, an investor has the option to hold the stock even if it trades on the OTC. Just the ticker will change to a five letter ticker.

Many large-cap multinationals trade on the OTC markets. Some of them are: Nestle (NSRGY), Roche Holding(RHHBY), Imperial Tobacco Group(ITYBY), DBS Group Holdings (DBSDY),etc. Some of the German companies that moved from exchanges to OTC in recent years include Bayer (BAYRY), BASF Group (BASFY) and Deutsche Telekom (DTEGY).

In January of 2014, Siemens announced plans to delist from NYSE and move to the OTC. Currently it trades on the OTC market with the ticker SIEGY. While listed on the NYSE it traded with the ticker SI.

2. Company terminates its ADR program:

Sometimes a company may just terminate its ADR program for some reason. In such situations the ADR depository will notify ADR holders of the choices to redeem their ADRs. A company may simply terminate the program and payout a specific dollar amount for stockholders to surrender their stocks. Or a company offer the option to convert the ADR into the common stock trading on its domestic exchange in their home country. Very few companies offer this option due to the logistics, tax and other factors involved.

Some firms may decide to terminate its sponsored ADR program but let it trade in the unsponsored category. This decision is made by the ADR depository if there is trading interest and not by the company. Depositories can create unsponsored ADR programs without a company’s consent.

An example of ADR termination notice can be found here for Allied Irish Banks plc.

Updates:

  • Bank of Ireland (IRE) ADR is already delisted from the NYSE. The bank’s ADR stopped trading on the NYSE on Feb 12, 2015. More details can be found in this article. However until April 22, the ADR will trade on the OTC market under the ticker IREBY.It will be delisted from the OTC market also effective April 22, 2015. If you hold the ADR, go here for your options.

Since the beginning of the year, some ADRs mainly those trading on the  OTC markets have been terminated.

Updated (2/1/21):

From the article What the Delisting of Chinese ADRs Means for Investors at WSJ:

What happens to the value of delisted ADRs? Are they worthless?

The receipts won’t be worthless—effectively they still represent an economic interest in the company. Holders could still collect dividends, for example. But only non-American entities will want to buy the ADRs, which is likely to reduce their value, and they could become difficult to trade and to value.

What can investors do when a stock is going to be delisted?

Investors in the Chinese telecom carriers can sell their ADRs on NYSE before they are delisted or convert them to the Hong Kong-listed ordinary shares. But the U.S. ban also prohibits American investors from buying securities that trade on any exchange anywhere, or even just over-the-counter, so switching into Hong Kong shares might only buy a few months’ respite.

What happens if investors don’t trade in their ADRs?

There is no requirement to sell until November, so investors could hold on until then. In addition, Nicholas Turner, a lawyer at Steptoe & Johnson LLP in Hong Kong, said the Treasury Department was unlikely to focus on individual investors who inadvertently bought into targeted companies. “Assuming that most financial institutions will follow the rules, most U.S. retail investors will simply lose access to opportunities to purchase the securities,” he said.

Institutions that buy blacklisted stocks after Jan. 11 could be penalized. Mr. Turner said the International Emergency Economic Powers Act allows the Treasury to levy fines of more than $307,000 for each violation or twice the value of a transaction, though it often cuts penalties if companies cooperate and make efforts to fix compliance failings.

Related Links (Updated 1/3/2026):

Related Posts:

Disclosure: No Positions

Why Canadian Stocks May Outperform US Stocks This Year

U.S. stocks, as measured by the S&P 500 index outperformed Canadian stocks last year. This was because the S&P 500 has a heavy concentration of IT stocks. This sector accounted for some 40% of the out-performance of the index last year against Canada’s benchmark S&P/TSX Composite index according to a research report by CIBC World Markets. As IT stocks, especially the social media stocks soared last year the S&P 500 boomed as well. The IT sector has a weighting of 19.3% as of today in the index.

The S&P/TSX Composite index lagged the S&P 500 due to the low weightage of tech stocks in the index. The tech sector accounts for only 1.80% of the index now.Energy and materials are two of the largest sectors in the index after financials. As these two sectors perform well this year, the TSX Composite may outperform the S&P 500 whose tech sector is not having a great run this year.

The following chart shows the sector breakdown of the S&P 500 index:

Click to enlarge

SP 500 Composition chart

The following chart shows the sector breakdown of the S&P/TSX Composite index:

SPTSX COMPOSITE chart

Source: Standard & Poor’s

The Canadian economy is mainly a resource-based economy. Basically Canada digs up stuff from the ground like oil & natural gas, minerals and exports them to other countries in addition to other products like lumber, finished products like automobiles, etc. Hence the heavy concentration of these and financial sectors in the benchmark index.

Related ETF:

  • SPDR S&P 500 ETF (SPY)
  • iShares MSCI Canada Index ETF (EWC)

Disclosure: No Positions

Update:

As of August 6, 2014 the S&P/TSX Composite is up by 11.6%% year-to-date while the S&P 500 has increased by only 3.9% in price terms (excluding dividends).

Performance Review of Argentina ADRs Year-to-Date

The long-running battle between Argentina and some U.S. hedge funds took a turn for the worst yesterday when Argentina defaulted on its debt. Argentina has always been a basket case of economic and political mismanagement and hence this default is not a shock to most investors. Since the country is not a major economy at a global level the impact of this default on international equity and debt markets should be minimal and temporary.Eventually Argentina will work out some kind of deal with these holdouts and move on. It is unlikely that this default will trigger a major crisis like the European debt crisis or another recession.

From an article in Bloomberg on July 31, 2014:

With Standard & Poor’s saying Argentinais in default and last-minute plans to remedy the situation falling through, investor focus is turning to whether holders of $29 billion of bonds will demand immediate repayment.

The nation missed a deadline yesterday to pay $539 million in interest after two full days of negotiations in New York failed to produce an accord with creditors from its last default in 2001. A U.S. judge ruled that the payment couldn’t be made unless those investors, a group of hedge funds led by Elliott Management Corp., got the $1.5 billion they claimed.

Source: Argentina’s Default Clock Runs Out as Debt Talks Collapse, Bloomberg

Argentinian stocks have been extremely volatile recently and fell heavily after the default. But despite the fall, most Argentine ADRs are up by double digit percentages since the beginning of the year.

The following table shows the performance of Argentine exchange-listed ADRs year-to-date:

S.No.ADR NameTickerPrice as of July 31, 2014Year-to-date Change (%)
1EdenorEDN$14.55187.55%
2Pampa EnergiaPAM$10.3196.76%
3BBVA Banco FrancesBFR$12.9085.34%
4Banco MacroBMA$42.3274.37%
5Grupo Financiero GaliciaGGAL$16.1254.26%
6Transportadora de Gas del SurTGS$3.1143.32%
7IRSA Inversiones y RepresentacionesIRS$15.8430.80%
8CresudCRESY$13.0028.71%
9Telecom ArgentinaTEO$21.8926.97%
10Petrobras Argentina S.A.PZE$6.7321.26%
11Nortel InvesoraNTL$23.7319.25%
12YPFYPF$35.387.34%
13Alto PalermoAPSA$21.652.80%
14TenarisTS$42.97-1.65%
15TerniumTX$26.60-15.02%

Source: BNY Mellon

Financial institutions BBVA Banco Frances(BFR), Banco Macro(BMA) and Grupo Financiero Galicia(CGAL) are all up by over 50% YTD Banco Macro seems to be in a better position today than before with the bank reinstating dividend payments that was suspended a few years ago. last month the bank paid out a $1.25 dividend on its ADR.

Global X FTSE Argentina 20 ETF (ARGT), the country-specific ETF for Argentina is tiny with net assets of just over $11.0 million. As of July 30th, the fund is up by over 13% according to Yahoo Finance.

Disclosure: No Positions