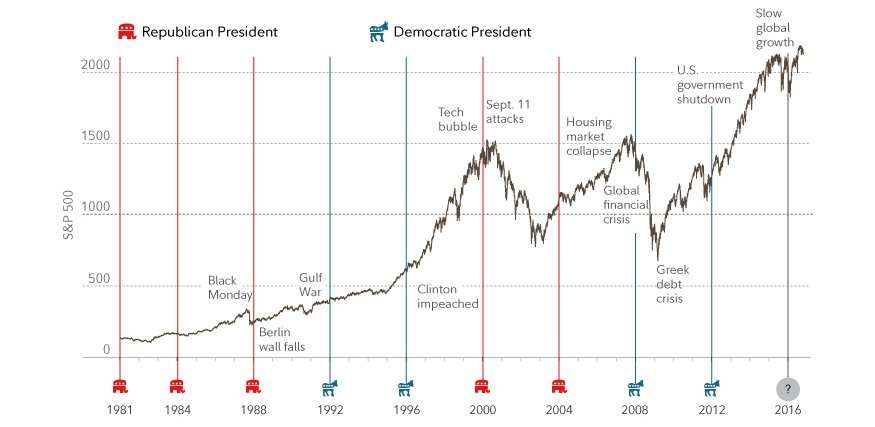
The US stock market as measured by the S&P 500 Index has fallen for nine days in a row due to the uncertainty over US elections. According to a journal article this is the longest losing streak for the index since 1980. Market participants are griped by fears of Trump winning the race or launching a legal battle if Clinton wins.
Should Trump win the election, the current prediction among experts is that stocks may crash on the day after the election with estimates reaching as high as 10%. Hence if the market falls 10% or even 15% what should an investor do?.
The key to remember is that the best time to buy stocks is when there blood on the streets. Just because Trump, a Republican, gets elected does not mean that the US will turn into a banana republic overnight. In fact, the chances of that happening are next to zero. So regardless of who wins the election, smart investors can take advantage of cheaper equity prices if other investors panic and dump stocks.
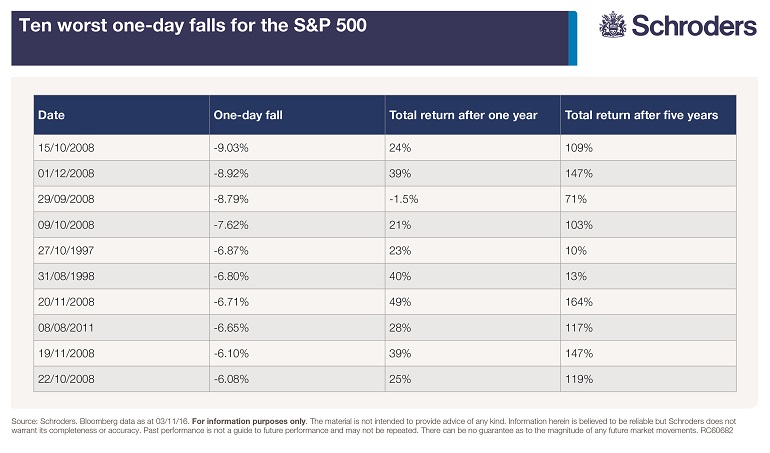
Generally US stocks have performed well in the years following a big one day decline. According to an article by Andrew Oxlade of Schroders, the S&P 500’s biggest declines have been followed by annual returns that average 14.9% over five years, From the article:
The US stockmarket has delivered average annual returns of 14.9% in the five years following its worst days of the past quarter century, according to analysis by Schroders.
The data underlines the historic resilience of shares over longer timeframes, even following major shocks.
The biggest rebound was a return of 164%, or an annualised 21%, in the five years after a crash on 20 November 2008, when the S&P 500 fell by 6.7%.
That date fell during a particularly gloomy phase of the 2008-09 financial crisis. Shares in struggling Citigroup fell by 26% on the day, shortly before a rescue deal was announced for the bank.
Given the abject mood of the time investors may have struggled to accept that an investment of $10,000 in the market made at the start of that turbulent day would have grown to $26,400 within five years, before charges.
Click to enlarge
Source: How the US stockmarket performs after heavy one day falls, Schroders
Similar to the US, the UK equity market also performed well following major one day declines. The strongest recovery for the FTSE All-Share was after during the Global Financial Crisis and when the British banking sector was hit hard on on March 2, 2009. The index soared by 126% in the following five years.
Related ETFs:
Disclosure: No Positions