Average Performance of S&P 500, MSCI World and FTSE All Share Indices in US Election Years

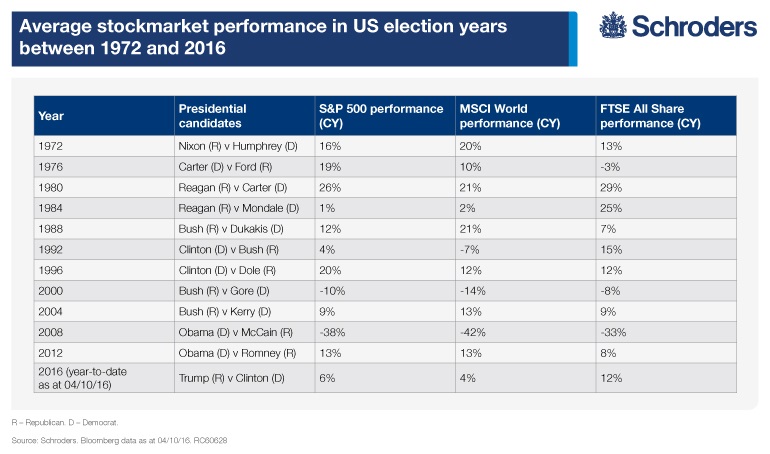
Stock markets in the US and the world generally tend to perform well in US election years Historical data analyzed by Schroders shows the S&P 500 rose in 9 out of the 11 election years. The MSCI World and FTSE All Share indices gained in eight of the 11 years.

Chart – Average Performance of S&P 500, MSCI World and FTSE All Share in US Election Years :

Click to enlarge

sp500-msci-world-and-ftse-all-share-performance-in-us-election-years

In addition, as I have written before S&P 500 outperformed in US election years when the Democrats won. However no clear trend emerges when we look at the performance during the entire term of a President as shown in the table below:
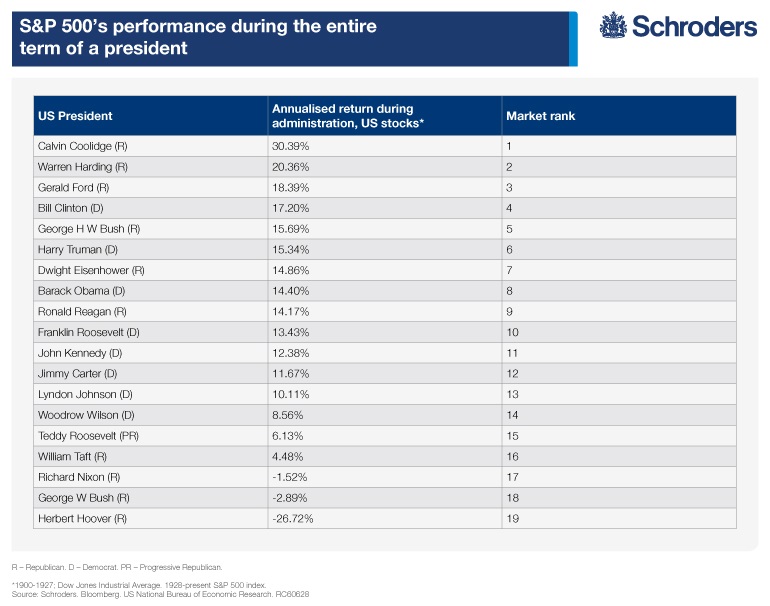
sp500-performance-during-a-us-president-term

SourceAre presidential elections good for US and global stockmarkets?, Schroders

The key takeaway here is that it is not possible to predict how markets will perform whether the elected President is a Democrat or a Republican. So investors are better off not worrying about the elections and focus on their long-term strategy for investment success. In fact, investors willing to deploy capital can take advantage of the current market volatility due to the fear of  Trump,a Republican nominee taking the White House and add high-quality stocks at cheaper prices.

A long-term investment strategy pays off as shown in the chart below:

Click to enlarge

xx

sp-500-growth-during-us-presidents-terms

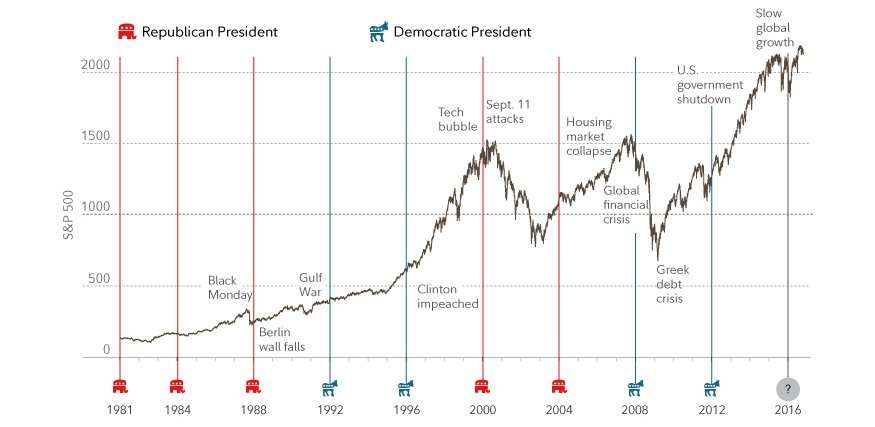
Source: Will the election impact your investments?, Fidelity

Also seeUS GDP Growth: Democratic vs. Republican Presidents, TFS

Related ETFs:

  • iShares MSCI World ETF (URTH)
  • iShares MSCI United Kingdom ETF (EWU)
  • SPDR S&P 500 ETF (SPY)

Disclosure: No positions

No. Tech Stocks Are Not Better Than Utilities For Income

Income seeking investors should not prefer tech stocks over utilities even though the former may feel like the best. In this post let me discuss some of the reasons for this view.

I came across an article titled “Tech vs. Utilities: Which Is a Better Income Strategy?” by Jeremy Schwartz, Director of Research  at WisdomTree Funds. In this piece Mr.Jemery lays out the case for why tech stocks are better to own for the future than utilities that income investors have traditionally preferred.

A few reasons he notes in favor tech stocks are that they pay dividends, dividends are growing and they are buying back large number of their own shares. Below are two charts that are included in the article:

Click to enlarge

Shareholder Yield: Dividend Yield Plus Net Buyback Ratio


shareholder-yield-tech-vs-utilities

Net Buyback Ratio

net-buyback-ratio-tech-vs-utilities

Source: Tech vs. Utilities: Which Is a Better Income Strategy?, WisdomTree Funds, Oct 31, 2016

Compared to the tech sector, he points out that utilities have been issuing new shares thus diluting existing shareholders.

Despite the arguments put forward by Jeremy investors should not consider tech stocks to be equivalent to or even better than utilities for income. Some of the factors that support utilities over tech stocks are listed below:

  • Though large tech stocks are paying a decent dividend now, up until a few years ago most of them did not pay any dividends at all. So they are starting from zero. Hence any dividend by these companies may seem great.
  • Moreover most tech companies including Apple(AAPL), Microsoft(MSFT), Cisco(CSCO), Intel(INTC) and IBM(IBM) spend more on stock buybacks than pay out dividends. These buybacks are not equivalent to dividends paid in cash. Buybacks generally do not benefit income seeking investors.
  • Utility firms in most US markets are monopolies or oligopolies. Hence it is impossible if not very difficult for other firms like startups to uproot them. This is not the case with tech companies. A startup or another competitor can offer the same or better product or technology making the established players like Cisco irrelevant in the marketplace. So 10 years or 20 years from now there is no guarantee that Cisco or Facebook(FB) or Intel will exist.
  • Utilities issuing new shares is raising capital and utilities by definition is a capital-intensive industry.So just because some utilities are issuing new shares and tech firms are buyback shares in the billions does not mean utilities are less attractive to own for yield investors.

In a nutshell, Cisco offering 3.40%, Intel paying 2.99% and IBM yielding 2.67% in dividends is not the same as a similar yielding utility stock. So investors are wise to not rush into these and other dividend-paying tech stocks believing that they are better for the future.

Disclosure: No Positions

Comparing the Performance of Canadian Bank Stocks

The Canadian banking industry is highly concentrated with six major banks dominating the market. After surviving the Global Financial Cisis(GFC) relatively unscathed the banks were performing well until the commodity boom ended. The stocks of these banks declined some but did not collapse. With the recent recovery in commodities especially in the price of crude oil the banks have recovered also.

Among the five banks listed on the NYSE, which bank has had the best performance in the past five years?

Click to enlarge

canada-bank-stocks-5-year-returns

Source: Yahoo Finance

Royal Bank of Canada (RY) is the top performer with a price appreciation (excluding dividends) of over 38% in the last 5 years and the worst performer is Canadian Imperial Bank of Commerce (CM) with a return of about 4%. As Royal Bank is the most profitable bank it is not surprising that the stock has outperformed the other banks.

All the five banks pay excellent dividends with current yields exceeding 3%. Hence to compare long-term performance we must use the total returns which includes dividends reinvested. Based on this measure also Royal Bank beat others. For example, an investment of $10,000 five years ago in each of these banks would have grown to the following figures:

Bank of Montreal (BMO) – $14,165

Bank of Nova Scotia (BNS) – $13,147

Canadian Imperial Bank of Commerce (CM) – $13,343

Royal Bank of Canada (RY) – $16,726

Toronto-Dominion Bank (TD) – $14,773

Note: Data shown are based on S&P calculations and are as of Oct 28, 2016

So the key takeaway is that over long-term the most profitable and consistent dividend payers yield the highest return.

Disclosure: Long all five banks

Knowledge is Power: Algorithms, Trump Has Already Won? , Deutsche Bank Downfall Edition

museum-at-oxford-university-uk

Museum in Oxford University, UK

The Structure of the Tata Group of India

The economies of many emerging and frontier markets are dominated by a small group of companies owned by powerful families. Next to state-owned enterprises these companies usually conglomerates are the major employees in a country. Majority ownership of companies by families has both advantages and disadvantages which I will discuss in a future post. Family-owned conglomerates may have some parts of their companies publicly listed. But the controlling ownership stakes in these firms will still be held by the families or individuals connected to them.

One of the dynastic family-owned conglomerates in the world is the Tata group of India. This group owns hundreds of companies that produce everything from cars to software to watches and running hotels.One of the group companies Tata Motors Limited (TTM) trades on the NYSE.

The chart below shows the structure of the Tata group:

tata-group-structure

Source: What next for Tata Steel?, FT Alphaville

Of all the firms owned by Tata, the IT outsourcer Tata Consultancy Services (TCS) is the most profitable.

Also checkout: 

Disclosure: No Positions