We have looked at S&P 500 companies’ sales by region/country before. In this post let us review the revenue composition of European companies by region/country using the The STOXX Europe 600 Index.
The STOXX Europe 600 Index is represents 600 large, mid and small capitalization companies across 17 countries of the European region: Austria, Belgium, Czech Republic, Denmark, Finland, France, Germany, Ireland, Italy, Luxembourg, the Netherlands, Norway, Portugal, Spain, Sweden, Switzerland and the United Kingdom. So this index is an ideal choice to evaluate sales since it gives a broad exposure not only countries but also includes companies of all sizes.
According to the authors of the above article a rising Euro and declining dollar has relatively low impact on the earnings of European firms since they have low exposure to the US market. From the piece:
Downside to the U.S. dollar’s decline?
As noted, the weaker U.S. dollar has aided U.S. companies which have international operations. However, there are two sides to a trade—a winner and “loser.” The sharp and ongoing rise in the euro versus the dollar has turned the 5% gain this year for the Europe STOXX 600 index into an 18% gain when measured in dollars, nearly doubling the 10% rise in the S&P 500. While this outperformance has been welcomed by investors in international stocks, the downside of a stronger currency for European companies is that it could mean weaker reported earnings growth as sales in foreign currency translate into fewer euros. For example, $100 of sales at the beginning of this year was worth 96.1 euros, but as of the end of July it was worth only 83.4 euros—a 13% decline for the same dollar amount of sales.Fortunately, the stronger euro doesn’t seem to be weighing on profit growth for companies in the region. Profits are rising thanks to sales to the United States making up only 16% of the total for the companies in the MSCI Euro Index; and most sales coming from within Europe where economic growth has been solid, as you can see in the chart below.

Source: Schwab Market Perspective: Things are Looking Good … But are They Too Good?, Schwab
More than half of sales for the companies in the index comes from Europe and the UK. It is interesting to note that the US accounts for a large share of their revenues than Asia Pacific where two of the largest emerging countries are located. While some large-cap European multinationals have large exposure to emerging markets, on an aggregate most European firms depend on Europe. So when Euro strengthens and European economies are growing these companies prosper.
The chart below shows the long-term return of the index in Euro terms:
Click to enlarge
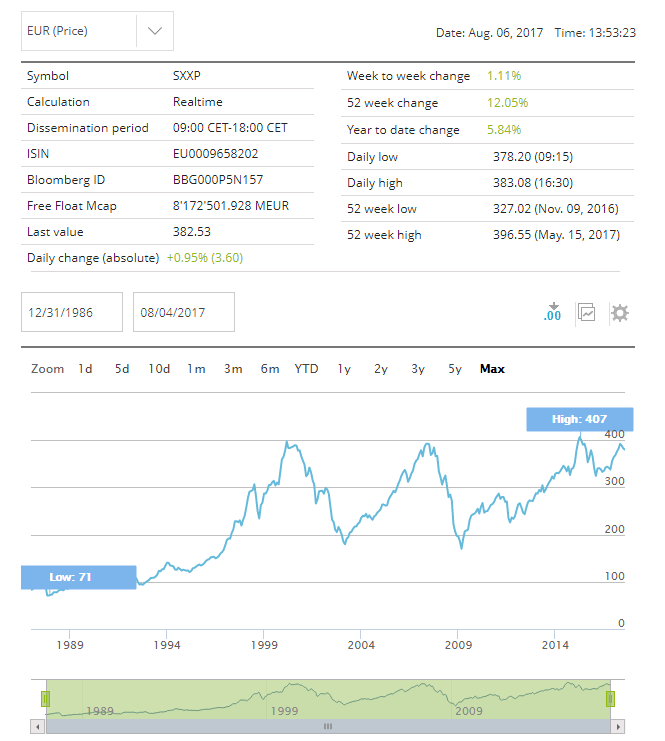
Source: STOXX
Ten components from the above index are listed below with their current dividend yield on the US market for further research:
1.Company: Nestle SA (NSRGY)
Current Dividend Yield: 2.68%
Sector: Food Products
Country: Switzerland
2.Company: Novartis AG (NVS)
Current Dividend Yield: 3.20%
Sector: Pharmaceuticals
Country: Switzerland
3.Company: Roche Holding AG (RHHBY)
Current Dividend Yield: 3.22%
Sector: Pharmaceuticals
Country: Switzerland
4.Company: Total SA (TOT)
Current Dividend Yield: 5.12%
Sector: Oil, Gas & Consumable Fuels
Country: France
5.Company: British American Tobacco PLC (BTI)
Current Dividend Yield: 3.43%
Sector:Tobacco
Country: UK
6.Company: Royal Dutch Shell PLC (RDS.A)
Current Dividend Yield: 6.56%
Sector: Oil, Gas & Consumable Fuels
Country: UK
7.Company: BP PLC (BP
Current Dividend Yield: 6.61%
Sector: Oil, Gas & Consumable Fuels
Country: UK
8.Company: Siemens AG (SIEGY)
Current Dividend Yield: 2.94%
Sector:Industrial Conglomerates
Country: Germany
9.Company: Sanofi (SNY)
Current Dividend Yield: 3.41%
Sector: Pharmaceuticals
Country: France
10.Company: BASF SE (BASFY)
Current Dividend Yield: 3.46%
Sector:Chemicals
Country: Germany
Note: Dividend yields noted above are as of Aug 4, 2017. Data is known to be accurate from sources used.Please use your own due diligence before making any investment decisions.
Disclosure: No Positions