US Presidential Election Results in 1928 vs.1932

Extreme financial hardship brought dramatic changes in the past to Germany and the US according to an article by Niels Clemen Jensen at ARP Investments. In Germany, hyperinflation in 1923 and the following Depression brought Hitler to power and led to the rise of Nazism.

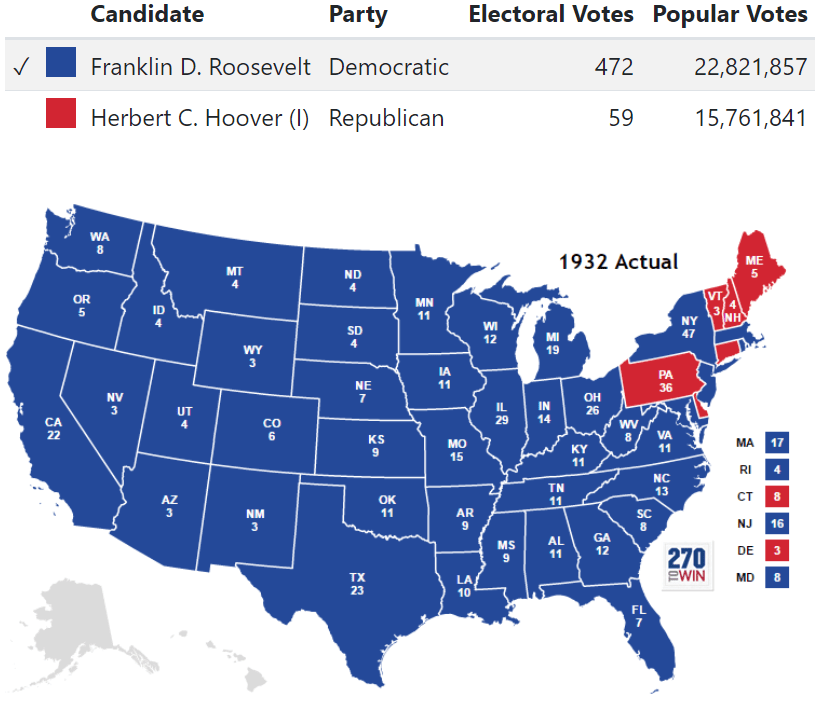
The Great Depression in the 1930s led to the dumping of Republican President Hoover and the election of Democrat Franklin Roosevelt by a landslide.

In 1928, Republican Herbert Hoover won both the popular and electoral votes to become the President as shown in the chart below:

Click to enlarge

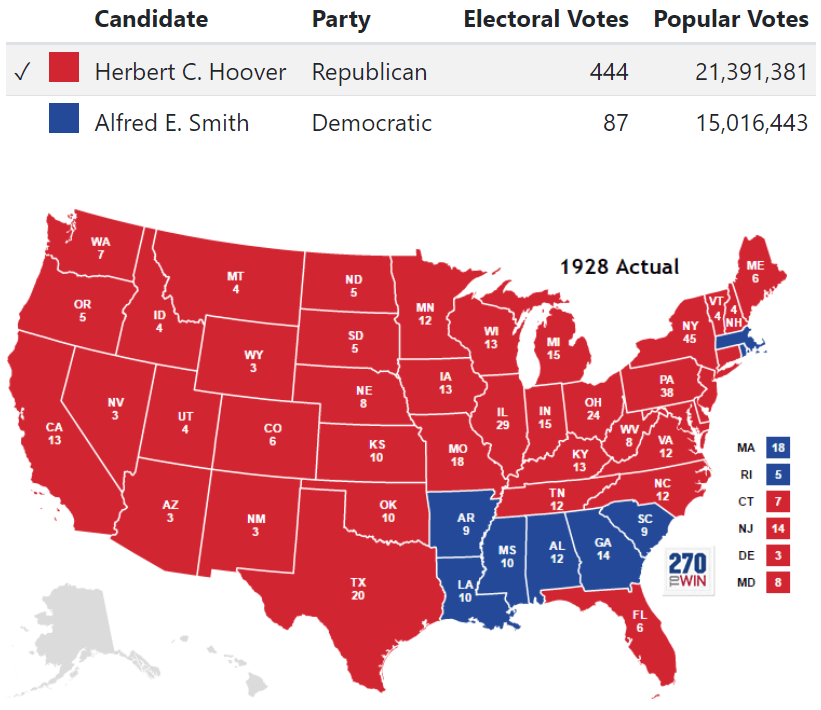
However after years of suffering in the depression, the American population turned against Republicans and voted in Democrat Franklin Roosevelt.


Source: Five Lessons from History by Niels Clemen Jensen, The Absolute Return Letter, February, 2020

More recently financial hardship directly led to the election of President Trump in the last election including “deplorables” voting for a change.Out of desperation rural folks such as coal miners and others decided to go Republican.

Here is the million dollar question now. Economic issues helped Trump win the last time.With the economy going strong, will voters re-elect him again this time or look for a fresh face in the highest office of the land?

Dividend Withholding Tax Rates by Country for 2020

The Dividend Withholding Tax Rates by Country for 2020 has recently been published by S&P Global. This simple one-page is useful to any investor holding foreign stocks and receiving dividend income. This table shows withholding tax rates for stocks held in regular brokerage accounts only. It does not show the rates for assets held in qualified retirement accounts. For example, the rate for Canada is shown as 25%. This rate does not apply to Canadian stocks owned by Americans in retirement accounts like IRAs. Canada does not charge any taxes on dividends received in those accounts. So investors looking to avoid the withholding taxes can own Canadian stocks in retirement accounts.

Update – Click this link for 2022 rates: Dividend Withholding Tax Rates by Country for 2022

In addition, the 25% rate can be reduced to 15% by filing NR301 form with the Canada Revenue Agency (CRA). For more details on this form go here.

Investors should also pay attention to the difference in rates between REITs and non-REITs. For instance, UK charges no withholding taxes to US residents. However this rate does not apply to UK REITs Dividends paid out REITs would be charged at 20%.

Click to enlarge

Source: S&P Dow Jones Indices

Download:

Earlier:

The World’s Top 20 Arms Producing and Military Service Companies: Infographics

The World’s Top 20 Arms Producing and Military Service Companies are shown in the infographics below. As usual, US firms dominate the list taking 9 out of the 20 spots and 4 out of the top 5. The world’s largest weapons maker is Lockheed Martin(LMT). Though most people know Boeing (BA) as the maker of airliners, the firm is also leads the world in arms manufacturing. A new report shows that China is now the world’s second largest arms producer ahead of Russia. Traditionally Russia ranked the second, behind only the US.

Click to enlarge

Source: The World’s Largest Arms Producers, RFE/RL

The 5-year returns of the top 5 US defense stocks are shown in the following chart:

Source: Yahoo Finance

Most of them have doubled in price with only General Dynamics(GD) logging a growth of 28%.

Disclosure: No Positions

The Historical Average Annual Returns of Australian Stock Market From 1900 To 2019

The popular “120 Years of Historical Returns for Australian Sharemarket” has been updated MarketIndex site with data for year 2019. The overall average annual total return just slightly increased to 13.2% per year since 1900.

Update (5/30/21):

The Total Return for the All Ordinaries Accumulation Index in 2020 was 3.64%. The Price Only Return was just 0.71%.

Source: S&P Global

Note: The below chart will be updated with 2020 data when MarketIndex publishes the updated chart.

The following graphic shows the historical annual returns of Australian stocks from 1990 thru 2019:

Click to enlarge

Source: Market Index

Notes:

  • The returns shown above are total returns (i.e. share price returns + dividends).
  • The returns shown are in the local currency.
  • The returns are for the All Ordinaries Index.

Related ETF:

  • iShares MSCI Australia ETF (EWA)

Download:

See Also:

Disclosure: No Positions