Property taxes vary widely between states in the U.S. Property taxes are assessed as a percentage of the market value of a property. Hence if house prices increases in a year, a homeowner will pay more in property taxes for the same property. The higher the value of the property the higher the taxes. States property taxes to fund all types of expenses such as funding for schools, libraries, parks, etc. Generally property taxes tend be high for the services provided. However unlike other things property taxes and its uses are hyper local. So in one community higher property taxes may lead to better services and facilities while in another it may not.
Property taxes are mandatory and is usually one of the largest expenses a homeowner faces after mortgage payments. Over the lifetime a homeowner may end up paying hundreds of thousands of dollar in taxes for the privilege of owning the home.
Some of the states with high property taxes are Texas, Illinois, New Hampshire and New Jersey. So it is not uncommon for some people to flee from high property tax states to lower tax states.
The following chart shows property taxes as percentage of occupied-housing value by state for 2019:
Click to enlarge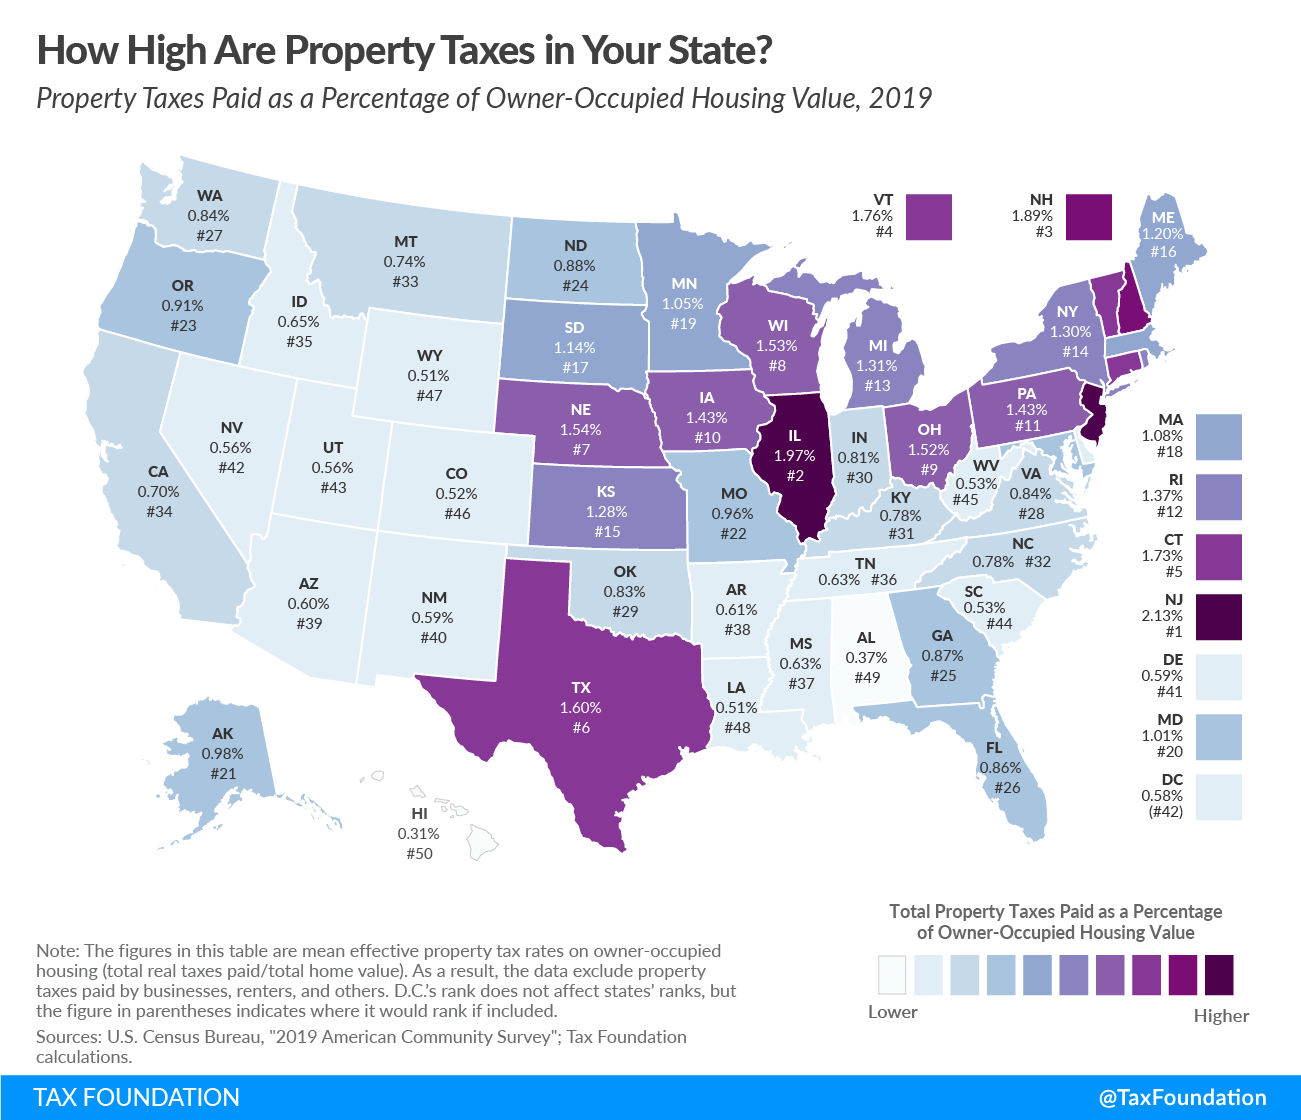
Source: How High Are Property Taxes in Your State? by Jannelle Cammenga