The Dividend Withholding Tax Rate for Singapore is 0% (excluding REITs) for US investors. The tax rate on REITs is 10% for 2022. Singapore has always had no withholding taxes on dividends paid out domestic firms to US investors. This makes the Singapore market attractive. However one important point to remember is that the dividends are NOT considered as “Qualified” dividends by the IRS for tax purposes. So instead of the reduced rate of qualified dividends American investors will pay their individual marginal tax rate on those dividends since they will be considered as “Ordinary” dividends. This rate will most likely be higher than the qualified rate.
Unlike many other countries, Singapore dividends are treated as ordinary dividends because the US does not have a tax treaty with Singapore. Tax treaties between countries allow for reduced rates or to avoid double taxation. Though Singapore is a developed country and is a global financial hub, it is said that the US has no tax treaty with Singapore.
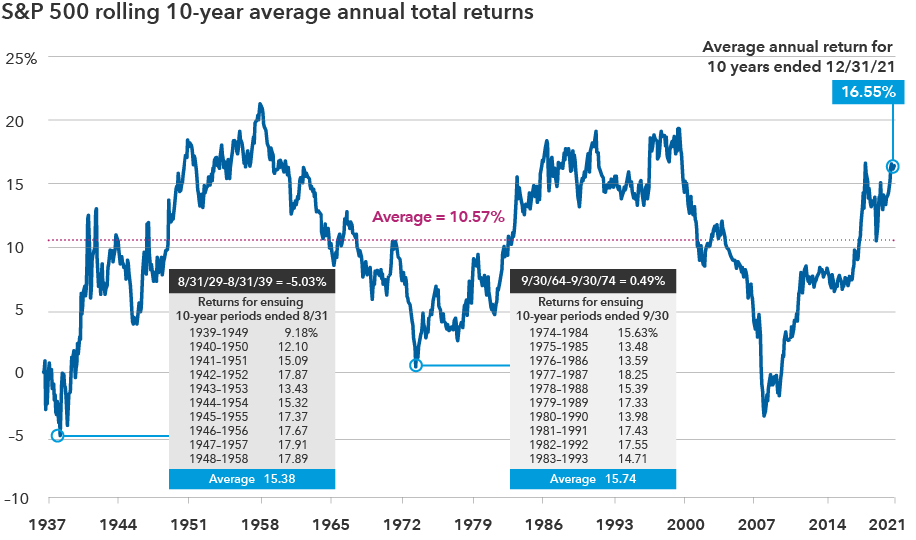
Another point is many Singapore stocks are known are their high dividend yields. For example, the dividend yield of the benchmark Straits Times Index (STI) was 3.6% as of November, 2021 (in Singapore Dollars). This is much higher than the 2.35% on the S&P 500 (in SGD). In US dollar terms, the S&P 500’s dividend yield rarely crosses 2%.
Currently just two Singapore companies trade on the US exchanges. However about 44 firms trade on the OTC markets. The country’s banks traditionally tend to have high dividend yields. For example, the DBS Group Holdings Ltd (DBSDY) currently pays $4.04 in dividends per year for a yield of 4.40%. But this rate will be effectively reduced since they are ordinary dividends and not qualified dividends which can be as low as 10% or 15%.
So investors need to be aware of this important rule and make their investment decisions accordingly.
Related:
- The Complete List of Singapore ADRs
- United States Income Tax Treaties – A to Z, IRS
- Singapore – Individual – Foreign tax relief and tax treaties, pwc
- Are Overseas dividends qualified?, Intuit
Related ETFs:
Disclosure: No positions
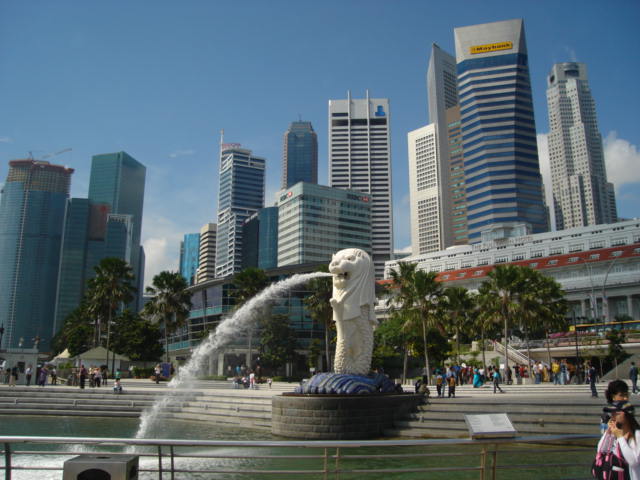
Singapore Downtown Skyline