Intra-year declines in the equity markets are a common occurrence. At the risk of stating the obvious, stocks never only go up always. In any given year, stocks decline significantly though the course of the year for any number of reasons but end up the year with a positive total return. Stomach-churning volatility can shake the conviction of even the most patient investors.
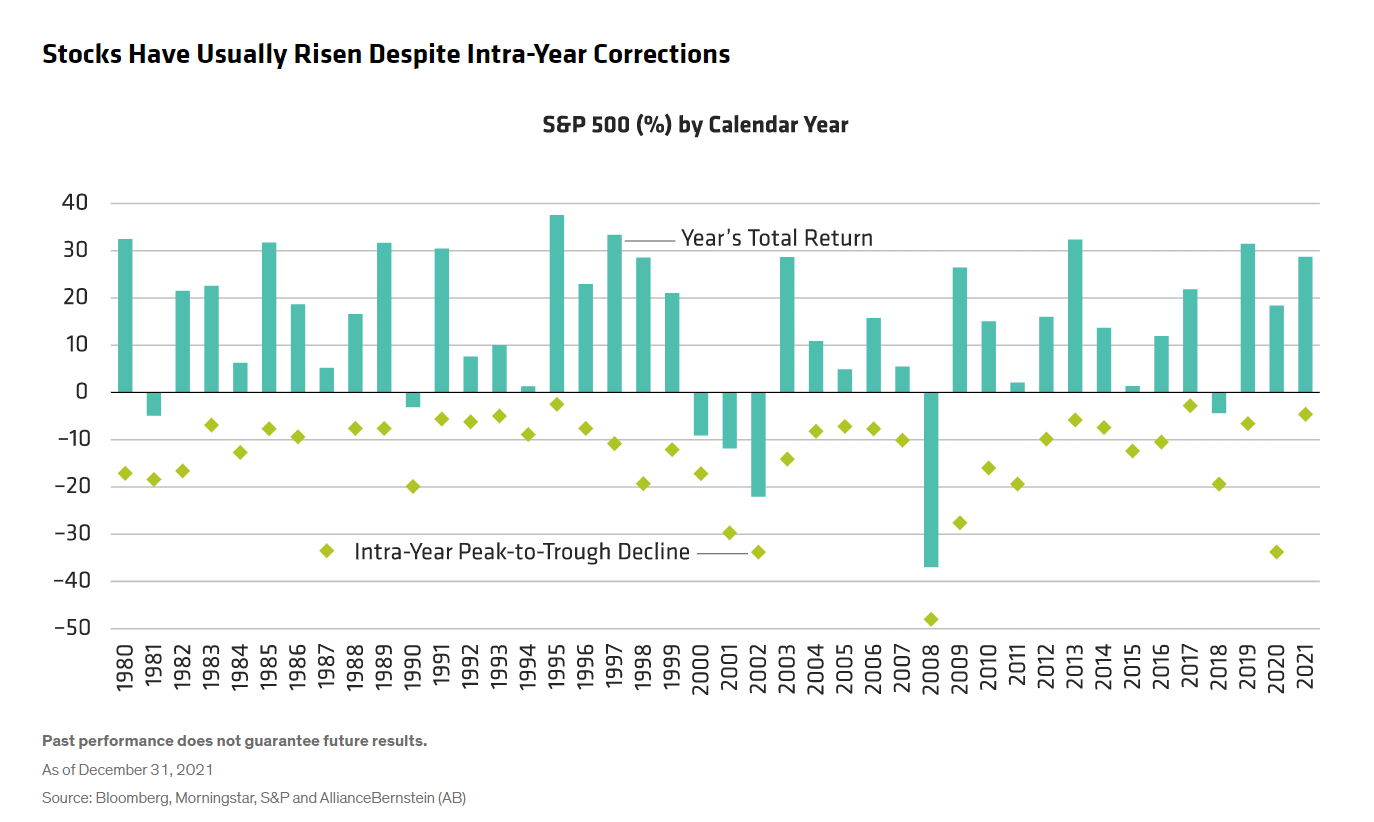
The following chart the intra-year declines for the S&P 500 and the yearly total returns for the S&P 500 index from 1980 to 2021:
Click to enlarge
Source: Alliance Bernstein
During the period shown, the S&P has had negative returns for the year less than 10 times. Moreover consecutive down years in a row are rare. The last time this occurred was after the dot-com implosion.
The key takeaway is that returns for the whole year is what matters. Not the intra-year declines.
Related ETF:
- SPDR S&P 500 ETF Trust (SPY)
Disclosure: No positions


