Small-Caps may offer better Investment Opportunities for an Economic Recovery

Generally small caps yield higher returns over large caps over long periods. In the last decade small cap stocks easily beat large cap stocks in terms of returns. From an article I wrote in May:

  • The S&P 600 Index, a small-stock index, gained nearly 100% in the decade that began Jan 1, 2000  , producing an annualized return of 7.1%. In the same period, S&P 500 has lost almost 2% per year for a total loss of about 18%.
  • Small caps benefit more quickly when the economy recovers.

The current recession started in December 2007 and ended in June 2009 according to by the National Bureau of Economic Research (NBER).

The chart below shows the one,three and five-returns of small, mid and large-caps beginning from the mid-point of each recession:

Click to enlarge
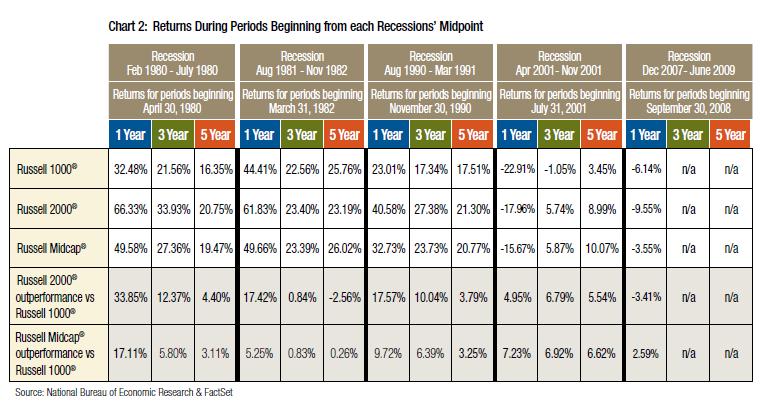
Small-Large-Mid-Cap-Return-Comparison

Source: Smaller-Cap Equity Performance Coming Out of a Recession by Michael Weiss and Yuliya Tarasava,  Managers Investment Group

Small-caps as noted by The Russell 2000 Index have outperformed large-cap stocks following all of the recessions except the 5-year period associated with the 1981-82 recession and the 1-year period associated with the 2008-09 recession. However, mid-cap stocks outperformed large-cap stocks following all of the recessions.

The authors note that ” it is important to note that the smaller-cap stock underperformance exception that occurred after the 1981/1982 recession came after a long period of small-cap stock dominance over large-cap stocks. According to Morningstar/Ibbotson Associates’ 2008 SBBI Yearbook, from 1971 through 1980,small-cap stocks returned 17.53%, substantially outperforming large-cap stocks, which returned 8.44%.

Similarly,relative asset class performance during the downturn period for the 2008/2009 recession might explain the one-year performance exception.”

Why do smaller-cap stocks perform better than large-cap stocks coming out of recessions?

Michael and Yuliya mention the following key arguments to support the theory for the relative outperformance of smaller-caps:

“First, in order to adjust to an environment moving from contraction to expansion, a company needs to be nimble. To that end, small- and midsized companies are generally better able to quickly add to their work forces and ramp up production in anticipation of an improvement in the economy.

Second, small caps generally experience steeper declines early in a recession due to a flight to safety that naturally occurs, resulting in oversold conditions and undervalued small- and mid-cap stocks.

Third, smaller companies tend to get a performance boost when merger and acquisition activity increases, which is common toward the end of a recession when valuations become more attractive and larger companies look for ways to grow their businesses.”

It must be noted that small-cap stocks are extremely risky and can be highly volatile. Hence an investor can allocate a small portion of their portfolio to small caps and use a mutual fund or an ETF instead of picking individual stocks.

Related ETFs:
U.S. Small Cap ETFs
iShares S&P SmallCap 600 Index Fund (IJR)
iShares Russell 2000 Index Fund (IWM)
SPDR DJ Wilshire Small Cap ETF (DSC)
Vanguard Small-Cap ETF (VB)

International Small-Cap ETFs
iShares MSCI EAFE Small-Cap Index Fund (SCZ)
International Small-Cap Fund (GWX)
Vanguard FTSE All-World ex-U.S. Small Cap ETF (VSS)
SPDR S&P Emerging Markets Small Cap (EWX)

Disclosure: Long GWX
Emerging Markets: Correlation Between Economic Growth and Stock Market Returns

The MSCI Emerging Market(EM) Index has posted an annualized return of 10.2% over the past 10 years thru the end of 2009. Due to this solid performance and other factors investors are increasingly attracted to EM equities. However many studies have proven that economic growth does not automatically translate into higher stock market returns.

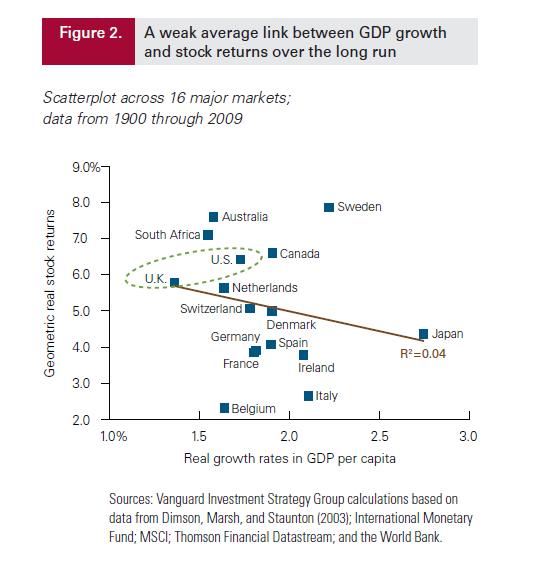
In a study of 16 major markets by the Vanguard group, the correlation  between economic growth as measured by GDP per capita and long run stock returns since the 1900 was effectively zero. In the last decade, EM stocks performed well not because of economic growth per se but because of low valuations in early 2000s.  Globalization also plays an important factor impacting the relationship between economic growth rates and market returns. For example, U.S. corporate profits from direct investments abroad jumped from 20% in 1999 to 40% in 2008. Hence multinational firms contribute to the economic growth of emerging markets.

From the Vanguard research paper:

devloped-mkts-gdp-stock-returns.jpg

“Since 1900, the correlation between long-run economic growth (as measured by real GDP growth per capita, a standard proxy for a country’s productivity growth) and long-run stock returns across 16 major markets has been effectively zero.The slope of the line in Figure 2 is actually slightly negative.”  The study observed a similar relationship for emerging markets as well.

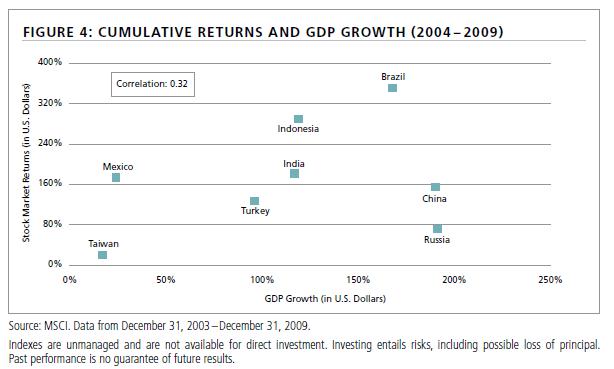
Another study by Neuberger Berman confirms that GDP growth does not necessarily translate to high equity returns. The chart below shows “the disparity between GDP growth rates and five-year cumulative returns for select emerging market countries.

em-gdp-markt-returns-select-countries.jpg

In U.S. dollar terms, the highest nominal GDP growth countries, China and Russia, did not produce the best stock market returns. Mexico, however, outperformed both countries with only about a sixth of their GDP growth. ”

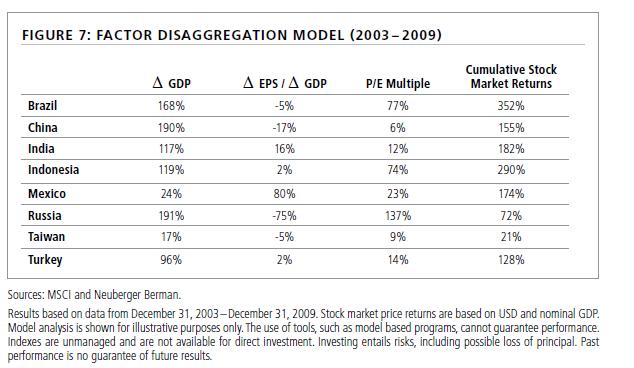
The study further analyzed the MSCI Emerging Markets Index data over a six-year time period from 2003 thru 2009 which coincided with one of the biggest bull markets in emerging markets history. This showed that “the impact of EPS growth (earnings to shareholders) and re-valuation (the price investors are willing to pay) had much larger impact on stock market returns than GDP growth”.

em-mkt-retunrs-analysis.jpg

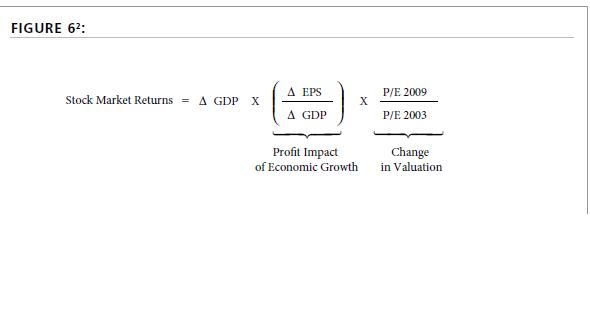
In the above chart, stock market returns was calculated by using the following formula:

em-forumal.jpg

Brazil and Indonesia were the best performing markets in the period studied. They achieved this growth by greater P/E expansion than their peers.Part of this P/E expansion can be attributed to the great run experienced by commodities.

China enjoyed a strong GDP growth but the stock market returns were mediocre.On the other hand Mexico had a much lesser economic growth but the stock return was higher. Similarly Russia had a strong GDP growth and P/E expansion but stock returns suffered due to the increased state ownership component within the benchmark. Despite strong economic growth in terms of market returns Russia was an underperformer.

Hence investors must focus on fundamentals of individual firms, profitability, valuation, etc. and follow a bottom-up strategy when investing in emerging markets as opposed to just looking at economic growth.

Related ETFs:
iShares Emerging Markets ETF (EEM)
iShares Brazil ETF (EWZ)
Market Vectors Russia ETF (RSX)
iShares Mexico ETF (EWW)

Sources:
Investing in emerging markets: Evaluating the allure of rapid economic growth, The Vanguard Group
Does Economic Growth in Emerging Markets Drive Equity Returns? , Neuberger Berman

Disclosure: No positions

Which is the World’s Best Stock?

The world’s best stock in terms of returns is not a U.S.-based company stock. Many people assume that Warren Buffet’s Berskhire Hathaway is the world’s best stock. However that is not true.

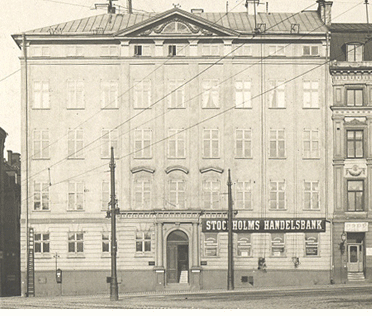
kornhamn_372_hogre.gifAccording to the Swedish business daily Dagens Industri’s stock market expert  and author Björn Wilke, Sweden’s Handelsbanken is the best stock in the world. The company first listed on the Stockholm Stock Exchange in 1873. Since 1900 the stock has gained unimaginable 1.9 million percent thru September last year. That amounts to 10 percent a year not including dividends. A $10 investment made in the stock in 1900 would be worth about  20 million dollars as of September 2009.

Compared to the performance of  Handelsbanken, Warren Buffett’s Berkshire Hathaway(BRK.A, BRK.B) has gained just 362,300% since Buffett’s takeover in 1964. And General Electric (GE) stock has grown 843,000% from 1900 to the peak of 2007. These findings were confirmed by researchers at the London Business School.

While past performance is not a predictor of future performance, it gives us an opportunity to analyze why and how some companies thrive against all odds while others perform poorly or yield mediocre returns.

Source: The Swedish Wire

A brief note on Handelsbanken:

The bank was founded in the spring of 1871 when a number of prominent companies and individuals in Stockholm’s business world founded “Stockholms Handelsbank”. At the outset, the bank proclaimed that it would pursue “true banking activities” with deposits and loans and that it would focus on the domestic banking market. Today the bank aims to be a universal bank with 460 branches in Sweden and operations in other Nordic countries and the U.K. Over the years Handelsbanken has followed a very conservative banking model which has led to its success.

Despite the recent financial crisis, the company has paid dividends to shareholders without a break in the past four years. Handelsbanken’s dividend policy is that the dividend should be competitive relative to other listed Nordic banks.  The bank’s ADR (SVNLY) is very thinly traded. Currently the stock pays a 3.11% dividend. The iShares Sweden ETF (EWD) provides exposure to this bank with an allocation of about 5% total assets.

Disclosure: No positions

Update:

Why Country ETFs Are Not the Best Way to Invest in Emerging Markets

ETFs offer one of the simplest and easiest ways to gain exposure to emerging markets.Investors have poured billions of dollars in emerging market funds making them some of the largest in the fund universe.However investing in emerging markets via ETFs or an index fund is not the best way to capture the growth of these economies. In this post let me explain this theory using two examples.

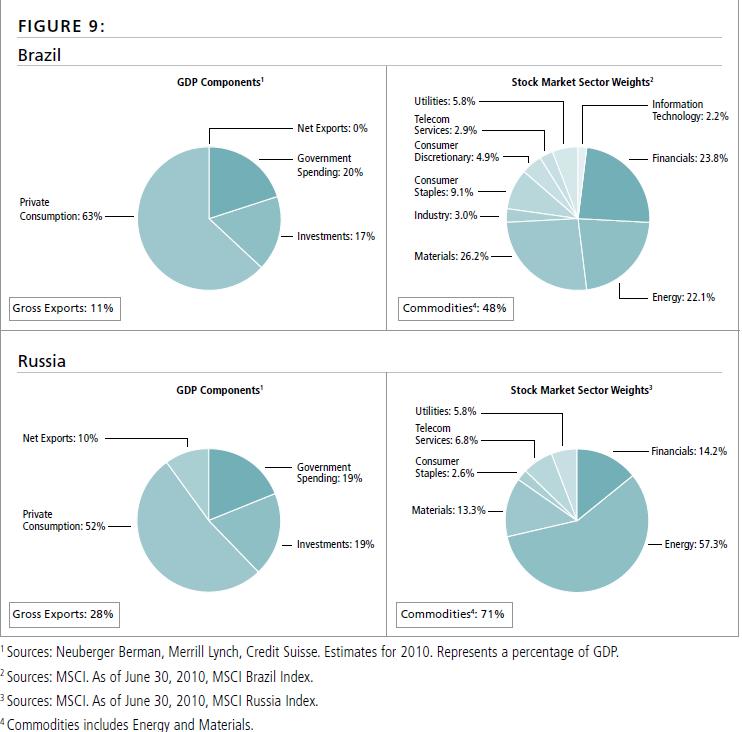
The graphic below shows the comparison of GDP composition and the respective MSCI Indices for Brazil and China:

Click to Enlarge

Brazil-Russai-GDp_MSCi-Index-Comparison

Source: Does Economic Growth in Emerging Markets Drive Equity Returns?, Neuberger Berman

P.S: The MSCI data shown above are as of June 30, 2010.

1. Brazil
Private consumption accounts for 63% of the domestic economy. But the Materials and Energy sector comprise 48% of MSCI Brazil Index. The allocation for consumer sector is very less especially when excluding Financials. As the iShares Brazil ETF (EWZ) tracks the performance of the  MSCI Brazil Index, the ETF does not offer a complete representation of the local economy. Sales of consumer goods such as household appliances, cars, etc. are growing strongly in Brazil. However as of September end, the iShares Brazil ETF has about 14% assigned to the consumer sector. Hence instead of picking up this ETF, investors looking to gain exposure to the Brazilian market may want to do a bottom-up approach and select individual companies.

2. Russia
Similar to Brazil, disconnect exists between the composition of the Russian economy and the underlying index. Private consumption is about 52% of the GDP. But commodities(Energy and Materials) constitute about 70% of the MSCI Russia index. The two country-specific ETFs available for Russia do not track the MSCI Russia Index. The SPDR S&P Russia ETF (RBL) tracks the S&P Russia Capped BMI Index  and allocates about 64% to commodities. Consumer sector accounts for just over 4% in this ETF. Van Eck’s Market Vectors Russia ETF (RSX) which replicates the DAXglobal® Russia+ Index also invests the most of the assets in the commodity sector. So investing in Russia via these two ETFs may not be the best way either.

Disclosure: No positions

Top 10 Gold and Forex Holding Countries

Gold prices have continued to rise since the July low of $1,160 an ounce. After the Fed’s meeting on Thursday, prices rose sharply and continued to go even higher on Friday and closed at $1,393.21. A Reuters article says that gold prices should continue for at least another six months.

From the article:

“Gold’s record-breaking climb should continue for at least six months, corresponding to the planned duration of the Federal Reserve’s monetary stimulus, according to a Reuters poll conducted on Thursday and Friday.

Two out of three respondents see  gold prices topping out between $1,400 and $1,500 an ounce on an interim basis, with most analysts surveyed expecting prices to peak during the first or second quarter of next year.

Thirteen of the 20 analysts, traders and fund managers polled by Reuters said the price of bullion will remain in an uptrend well into the first half of 2011, after the Fed on Wednesday unleashed a program to buy $600 billion of government bonds in a new round of quantitative easing (QE).

The Fed’s QE package has reinforced the argument for holding gold, as it pushes the dollar firmly onto a downward path and raises the risk of inflation.

“QE devaluates the currency, so gold…and almost all commodities will be beneficiaries as people start to switch from financial assets to commodities, something they feel more tangible as the money printing continues,” said Standard & Poor’s Equities and Metals analyst Leo Larkin.”

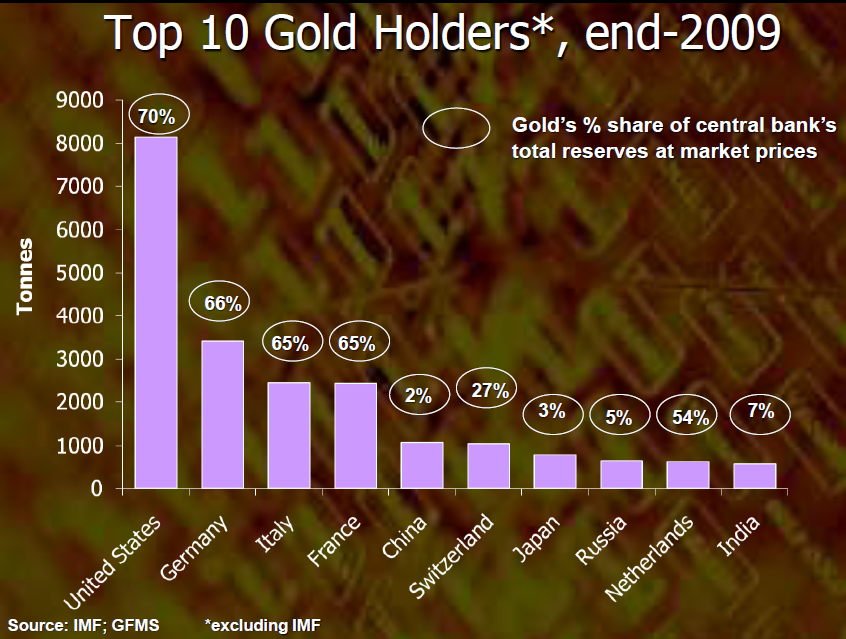
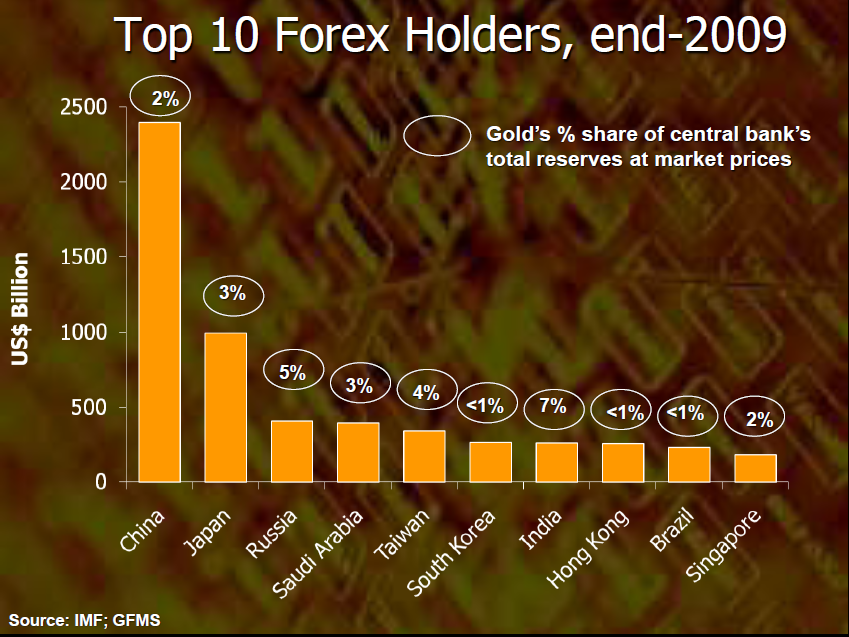
According to London-based GFMS, the world’s foremost precious metals consultancy, specializing in research into the global gold, silver, platinum and palladium markets, the total officially declared gold holdings at the end of 2009 was 30,623 tonnes with the IMF,US and China holding  10%, 27% and 3% respectively.

1) The Top 10 Gold Holders

Click to Enlarge

Top-10-Gold-Holders

2) The Top 10 Forex Holders

Top-10-Forex-Holders

Source:  The Official Sector: Gold Rehabilitated?, A presentation by Philip Klapwijk, GFMS Ltd.

Some of the key predictions made by Philip in the presentation are:

  • “Sovereign debt crisis will not last forever
  • Alternative investments may be attractive, e.g. Chinese government bonds
  • Gold price will eventually change direction
  • US sales unlikely but cannot be entirely ruled out over next decade
  • Off-market purchases may facilitate ‘transfer’ of bullion from West to East “