How Does the Federal Government Spend Our Taxes?

Americans pay billions of dollars in taxes each year to the Federal government. However when it comes to knowing how the government spends the taxes collected many people have misconceptions.

From an recent article in The Wall Street Journal:

“A recent Kaiser Family Foundation survey found that 40% thought foreign aid was one of the two largest federal-budget expenses. In reality, Uncle Sam spends $14 on Medicare—itself the second-largest expense—for every dollar spent on foreign aid.”

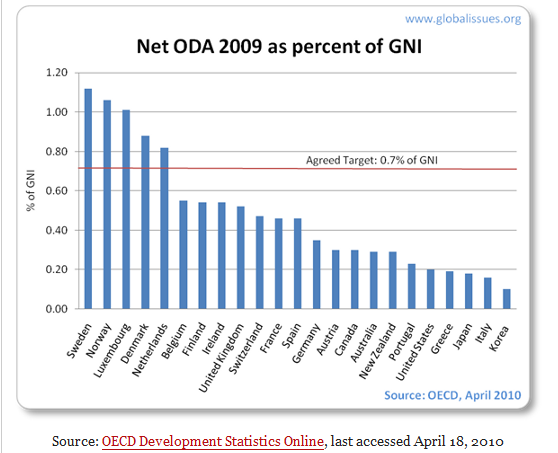
The reality is that U.S. gives lower foreign aid than many other developed countries based on Gross National Income. In 2009, Sweden and Norway were the top donors. In addition, the majority of U.S. foreign aid went to countries such as Iraq, Afghanistan, etc. for political and strategic reasons.
us-net-oda-2009.png

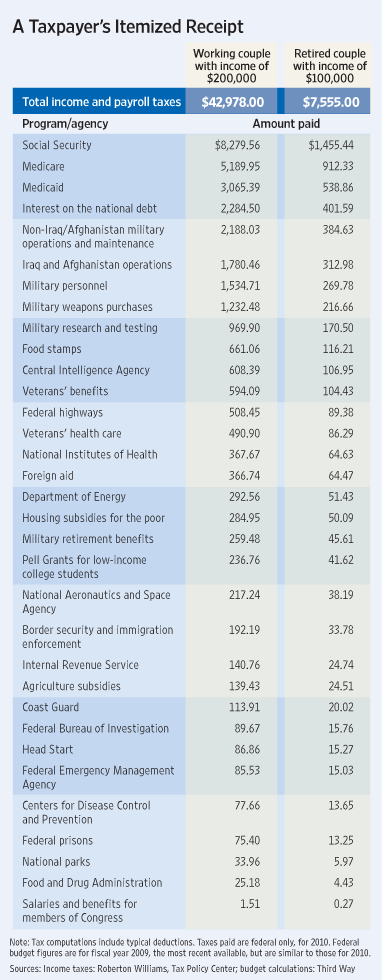
The not-for-profit Washington-based group called Third Way has produced an itemized taxpayer receipt shown below for the federal taxes of two couples:

Click to enlarge
us-taxes-how-govt-spends2.gif

Assumption: “The couple with $200,000 income has two children, ages 13 and 17, with one spouse earning $150,000 and the other $50,000. The couple with $100,000 of income is retired, with no dependents.”

Other then Social security, Medicare and Medicaid and Interest on national debt are two items that the Federal taxes spends the most tax dollars on. The portion of taxes going to Interest on national debt item is so high because as of 11/9/2010, the outstanding US debt held by the public is 9,135,403,570,564.55 according to the U.S. Treasury Department. The U.S. is net debtor country. Hence billions of dollars are paid by tax payers each year as interest payments to debt holders. A huge chunk of these interest payments is paid to China as they are the largest creditor to the U.S.  Last year the government paid about $500 billions in interest alone. In 2008 interest payments amounted to about 9.6% of total tax revenue. In one way it can be considered that about 10% of all federal taxes paid goes to waste in the form of interest on money borrowed. Another way to look at this figure is that 10% of all hard-earned money paid as taxes to the U.S. government goes to unproductive purposes because years of reckless borrowing and spending created the enormous public debt.

Related:

China vs. India: Economy and Government Finances

USA vs. UK: Government Finances and Size of Economy
12 Emerging Markets Dividend Stocks For Income

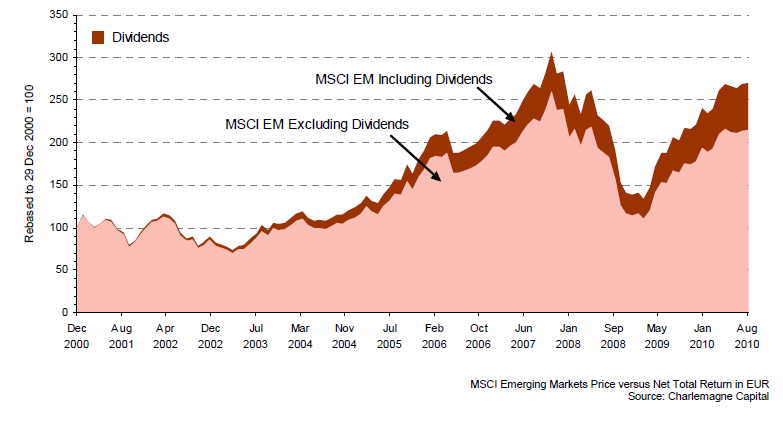
Investors have been attracted to emerging market equities for many years now due to their capital appreciation potential.Until recently not many emerging market stocks have been known for their dividends.However that paradigm is changing. Companies in developing countries are increasingly paying out a higher portion of their profits to investors in the form of dividends.

The following chart shows that increasingly dividends make up a significant portion of the EM total returns:

msci-em-divdend-growth.png

Some of the reasons for investing in emerging market dividend stocks include:

  • EM companies are changing their dividend policies to accommodate the demands of foreign investors who hold major stakes in these firms.
  • Low corporate debt  levels, improved governance and rising earnings allow companies to sustain dividend payments.
  • Asian firms have raised their dividend payout ratios to attract foreign capital and the ratio now stands between 30% to 40%.
  • Some companies are changing from growth-focused businesses to mature operations with the ability to pay dividends.
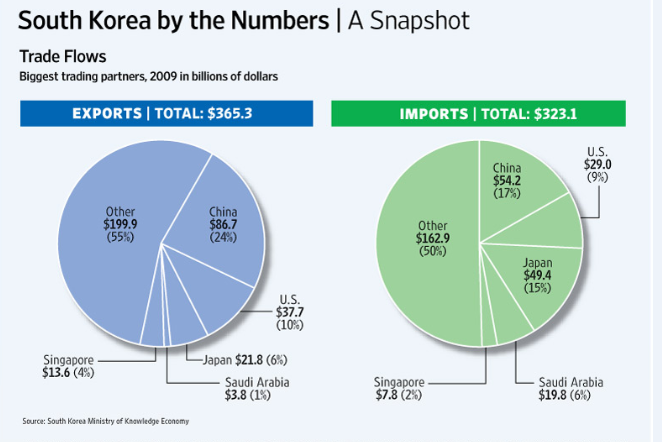
  • Among emerging markets, countries such as Brazil, Taiwan, Turkey and China have the most developed dividend cultures while South Korea and others have lower dividend payout ratios.
  • Brazilian companies are legally obligated to pay out over 20% of their net profits in dividends.
  • The EM universe has a sufficient number of dividend paying stocks.
  • The dividend growth rate of emerging stocks may outpace that of developed stocks.

In order to identify some dividend-paying stocks from emerging markets I used the Somerset Emerging Markets Dividend Growth and JPMorgan Global Emerging Markets Income Trust funds that trade in the UK. The following 20 stocks are the top holdings from both the funds. If a company trades on the US markets I have listed  the ADR ticker with the dividend yield as of November 9, 2010.

1. Inversiones Aguas Metropol  (IAMTY)
Current Dividend Yield: 10.36%
Gas,H20&Multiutility
Chile

2. AES TIETE (AESAY)
Current Dividend Yield: 8.34%
Electric Utility
Brazil
3. Cielo SA (CIOXY)
Current Dividend Yield: 7.60%
Financial Services
Brazil

4. Ford Otomotiv Sanayi (FOVSY)
Current Dividend Yield: 3.21%
Automobiles & Parts
Turkey

5. Siliconware Precision(SPIL)
Current Dividend Yield: 7.44%
Tech.Hardware&Equip
Taiwan

6. Philippine Long Distance (PHI)
Current Dividend Yield: 6.25%
Telecom
Philippines

7. China Pharmaceutical Group (CHJTF)
Current Dividend Yield: 4.96%
Drugs
China

8. Taiwan Semiconductor (TSM)
Current Dividend Yield: 4.24%
Semiconductor
Taiwan

9.Petrochina (PTR)
Current Dividend Yield: 3.58%
Oil
China

10. African Bank Investments (AFRVY)
Current Dividend Yield: 4.10%
Financial Services
South Africa

11. Telekomunikacja Polska (TKMGF)
Current Dividend Yield: 7.21%
Telecom
Poland

12. Zhejiang Expressway (ZHEXY)
Current Dividend Yield: 6.81%
Toll Roads
China

Other stocks in the funds mentioned above are High Tech Computer,Commercial Bank of Qatar,KT&G, Turkiye Petrol Rafinerileri, Maroc Telecom, Industries Qatar,Macronix International and Mediatek Taiwan. South Africa-based insurer Sanlam Limited is also a high-quality dividend paying stock.

Is Gold the Best Asset Class for All Economic Conditions?

gold-bars2.jpgIn the past few years Gold has become a much-talked about and safe-haven asset class. Investors have been piling into gold due to the credit crisis, collapse of equity markets, Greek debt crisis, continued devaluation of paper currencies and more recently the newly announced QE2 which will depreciate the value of the dollar further. As an example,the SPDR Gold Shares ETF(GLD) has an asset base of about $55 billion.

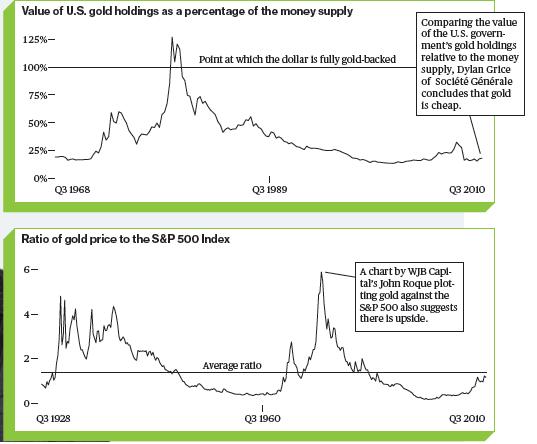
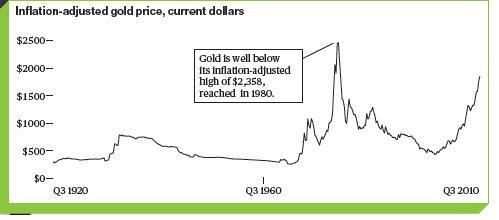
As of last week Gold has gained 28% this year and touched a record $1,398.70 an ounce. Barry Ritholtz, chief executive officer of FusionIQ  and the author of the popular “The Big Picture” blog, made the following comment in a recent Bloomberg BusinessWeek article. Barry considers three ways of valuing gold, shown below. “All three of the metrics suggest [gold] has not yet reached its highest potential price,” Ritholtz says. “Slapping a $2,000 target is not unreasonable, and breaching its inflation-adjusted target of $2,358 is also possible.” He adds an important caution: “Gold fever has risen to the point of excess, and gold shouldn’t account for more than 5 percent of your portfolio.”

gold-metrics-2.jpg

gold-metric-4.jpg

In a report, William Martin, Senior Vice President, Senior Portfolio Manager of American Century Investments says that unlike stocks and bonds whose returns are dependent on business conditions, gold actually tends to perform better during periods of economic and political uncertainty. He mentions a number of factors supporting investment demand for gold over the next decade.

From the report:

“To see how its unique supply and demand dynamics affect gold in different economic and market environments, we look at the performance of gold relative to U.S. stocks, bonds, and cash under three different historical periods: 1) hyperinflation, 2) low inflation, and 3) financial system crisis. We have intentionally chosen favorable comparisons for gold to illustrate our point that gold has the potential to outperform mainstream assets across diverse environments. ”

a) Gold performance during hyperinflation

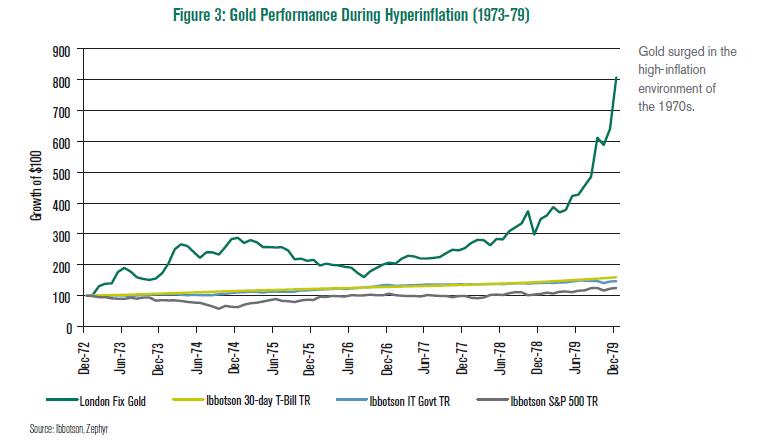
The graphic below shows the performance of gold against other asset classes during the hyper-inflationary period of the 1970s. The data used started from December 1972, since before that time the price of gold was pegged to the dollar at $35 an ounce.

Click to enlarge

Gold-during-hyperinflation

During inflationary periods such as the one shown above, as prices of goods and services rise, the value of paper currencies decline in purchasing  power since their values are not tied to a tangible asset. The value of the dollar has declined sharply since the 1970s relative to gold. Gold, on the other hand, offers some certainty during inflationary periods when paper currencies decline in value. Hence Gold can be used effectively as an inflation-hedging vehicle.

b) Gold performance during low-inflation

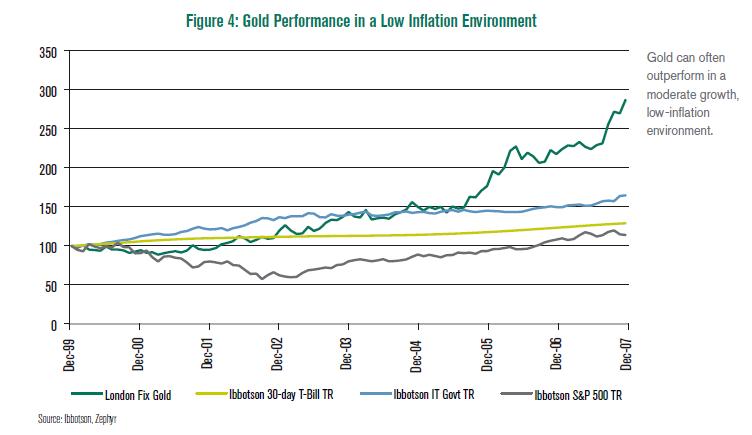
During periods of low-inflation gold can also outperform other assets. For example, during the moderate economic growth and low inflation period in the 2000s before the financial crisis, gold performed very well compared to other asset types as shown in the graphic below.:

Gold-during-low-inflation

One of the main factors that contributed to the positive performance of gold in the decade mentioned, is the rise of emerging markets where citizens invested their savings in gold due to cultural and other factors. Many political and economic crises during this time also forced investors to seek the safe-haven of gold.

c) Gold performance during crisis

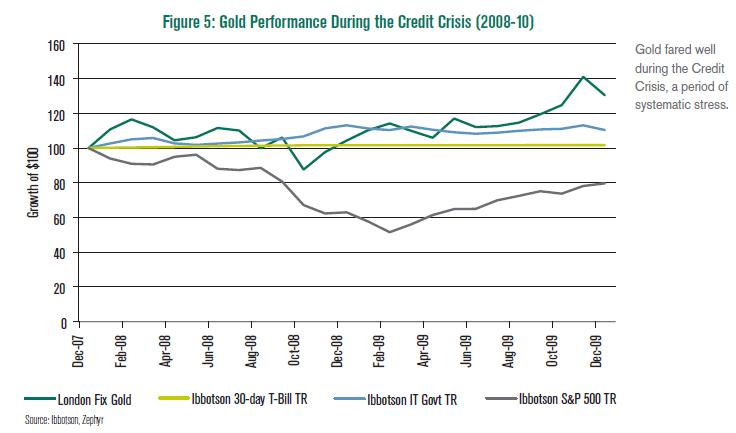
Gold has performed well during periods of stress in the political and financial systems. As shown by the chart below, gold outperformed other asset classes during the credit crisis in 2008 and the European sovereign debt crisis earlier this year. Investors are attracted to gold due to fear of sovereign credit defaults and deflation.

gold-during-credit-crisis.jpg

Overall gold is an excellent way to diversify your portfolio due to some of the reasons discussed above. Gold has low and in some cases negative correlations with other financial asset types. Hence allocating a small portion of assets to gold in a well diversified portfolio is a prudent strategy. However, it is not clear if gold is the perfect class for all economic cycles since the above analysis looked at a limited time-series of data. But the study shows that gold is a dependable asset class especially during periods when main-stream assets such as stocks and bonds decline sharply.

Source: Gold and the Decade to Come, William Martin, American Century Investments

Disclosure: No positions