Investors have been attracted to emerging market equities for many years now due to their capital appreciation potential.Until recently not many emerging market stocks have been known for their dividends.However that paradigm is changing. Companies in developing countries are increasingly paying out a higher portion of their profits to investors in the form of dividends.
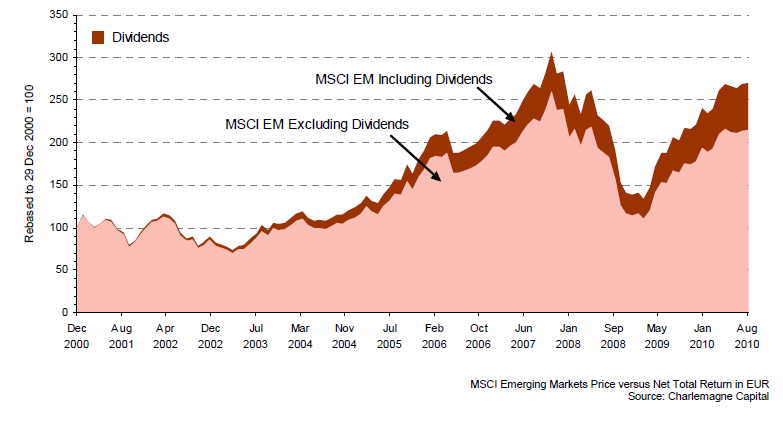
The following chart shows that increasingly dividends make up a significant portion of the EM total returns:
Some of the reasons for investing in emerging market dividend stocks include:
- EM companies are changing their dividend policies to accommodate the demands of foreign investors who hold major stakes in these firms.
- Low corporate debt levels, improved governance and rising earnings allow companies to sustain dividend payments.
- Asian firms have raised their dividend payout ratios to attract foreign capital and the ratio now stands between 30% to 40%.
- Some companies are changing from growth-focused businesses to mature operations with the ability to pay dividends.
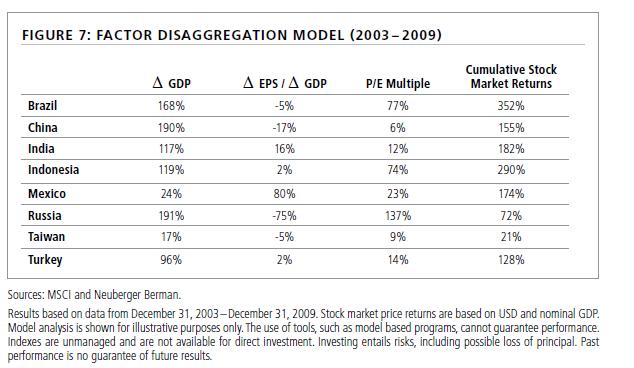
- Among emerging markets, countries such as Brazil, Taiwan, Turkey and China have the most developed dividend cultures while South Korea and others have lower dividend payout ratios.
- Brazilian companies are legally obligated to pay out over 20% of their net profits in dividends.
- The EM universe has a sufficient number of dividend paying stocks.
- The dividend growth rate of emerging stocks may outpace that of developed stocks.
In order to identify some dividend-paying stocks from emerging markets I used the Somerset Emerging Markets Dividend Growth and JPMorgan Global Emerging Markets Income Trust funds that trade in the UK. The following 20 stocks are the top holdings from both the funds. If a company trades on the US markets I have listed the ADR ticker with the dividend yield as of November 9, 2010.
1. Inversiones Aguas Metropol (IAMTY)
Current Dividend Yield: 10.36%
Gas,H20&Multiutility
Chile
2. AES TIETE (AESAY)
Current Dividend Yield: 8.34%
Electric Utility
Brazil
3. Cielo SA (CIOXY)
Current Dividend Yield: 7.60%
Financial Services
Brazil
4. Ford Otomotiv Sanayi (FOVSY)
Current Dividend Yield: 3.21%
Automobiles & Parts
Turkey
5. Siliconware Precision(SPIL)
Current Dividend Yield: 7.44%
Tech.Hardware&Equip
Taiwan
6. Philippine Long Distance (PHI)
Current Dividend Yield: 6.25%
Telecom
Philippines
7. China Pharmaceutical Group (CHJTF)
Current Dividend Yield: 4.96%
Drugs
China
8. Taiwan Semiconductor (TSM)
Current Dividend Yield: 4.24%
Semiconductor
Taiwan
9.Petrochina (PTR)
Current Dividend Yield: 3.58%
Oil
China
10. African Bank Investments (AFRVY)
Current Dividend Yield: 4.10%
Financial Services
South Africa
11. Telekomunikacja Polska (TKMGF)
Current Dividend Yield: 7.21%
Telecom
Poland
12. Zhejiang Expressway (ZHEXY)
Current Dividend Yield: 6.81%
Toll Roads
China
Other stocks in the funds mentioned above are High Tech Computer,Commercial Bank of Qatar,KT&G, Turkiye Petrol Rafinerileri, Maroc Telecom, Industries Qatar,Macronix International and Mediatek Taiwan. South Africa-based insurer Sanlam Limited is also a high-quality dividend paying stock.