Banks and Energy Companies Dominate China’s Top 10 List

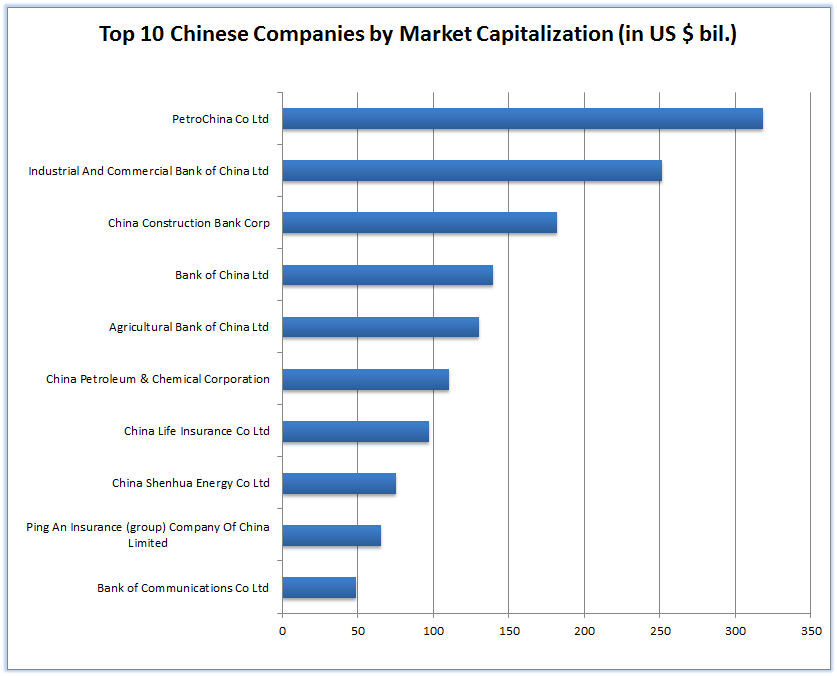
The graphic below shows the top 10 Chinese companies based on market capitalization in the domestic market as of November 18, 2010:

Click to enlarge
Top-10-Chinese-Companies

Source: FT Markets Data

Banking and energy firms dominate the list shown above with banks taking five of the ten spots. PetroChina (PTR), the integrated oil and gas producer, has the largest market cap in China. The other two energy firms with huge market caps are China Petroleum & Chemical Corporation (CEO) and China Shenhua Energy Co Ltd (CSUAY), the largest state-owned coal mining company in China. Shenhua is also the second largest coal miner in the world after Peabody (BTU) of the U.S. China Construction Bank (CICHY), Bank of China (BACHY) and Industrial And Commercial Bank of China Ltd (IDCBY) currently have dividend yields of over 3%. Ping An (PNGAY) is one of the large insurance companies selling insurance and financial services in China, Hong Kong and Macau. China Life Insurance Company Limited (LFC) is the world’s most valuable insurance company offering life and annuity products to consumers. At the end of 2009, China Life had 115 million individual and group life insurance policies, annuity contracts and long-term health insurance policies in force.

Top 10 Hungarian Banks by Assets

The Top 10 Hungarian banks based on assets as of December 2009 are listed below:

[TABLE=687]

Source: FT

Foreign banks have invested heavily in Hungarian banks. For example, MKB is majority owned by BayernLB. Raiffeisen is one of the leading Austrian Banks. CIB is majority owned by Intesa SanPaolo of Italy. GE(GE) of U.S. owns a major stake in Budapest Bank. Erste Bank(EBKDY) is another leading bank based in Austria. K&H is majority owned by KBC of Belgium.

Five Attractive Emerging Market Closed-End Funds

Closed-end funds are considered to be cheap when the market prices of their shares trade at a discount to their NAVs. Hence investors looking to add some of this asset type to their portfolio may want to pick them up when they trade at a discount as opposed to a premium.

From a recent Journal article on closed-end funds:

“The “closed end” label reflects the fact that these funds don’t continually issue new shares, as conventional open-end funds do. Among the key complexities to understand: Share prices often vary from the value of the underlying holdings, and many funds use leverage, which can affect both prices and income payments.

There are about 650 closed-end funds on the stock market today, with about $200 billion in assets. They range from multibillion-dollar leviathans to $30 million minnows.

More than 400 specialize in bonds. The rest cover the waterfront of investment opportunities. Do you want to invest in post-Castro Cuba? Herzfeld Caribbean Basin is set up to do just that (and generally gets a pop when the health of the Castro brothers leads the news in Miami). Fancy betting that the luck of the Irish will turn? Try the New Ireland Fund. Are you interested in Australian bonds? Try Aberdeen Asia-Pacific Income. (Don’t laugh: In the past 10 years that fund has quadrupled investors’ money. How has your portfolio done?)”

In this post lets take a quick look at five country-specific closed-end emerging market funds.

1. Thai Fund (TTF): This fund aims to achieve long-term capital appreciation by investing inequities of companies in Thailand. The fund has an asset base of $244 M. Financials make up about 30% of the portfolio. Currently the fund is trading at a 15% discount to the NAV. YTD the fund is about 44% based on market returns. The 5-year market return is about 12%.  The expense ratio is on the high side at 1.77%. From an investment perspective Thailand has high political risks. However many Thai firms pay high dividends and the private consumption of goods and services is growing. Hence among emerging markets, Thailand can be a destination for high-risk seeking investors.

 2. Turkish Investment Fund (TKF):  Financials account for about 40%  the fund with Turkiye Garanti Bank alone having a 19% allocation.  The total net assets of the fund is $150M and the expense ratio is 1.4%. YTD the fund’s share price is up 33%. Turkey’s financial system remained relatively unscathed during the financial crisis and the country’s economy will gain a big boost when Turkey gains entry into the European Union.

 3. Malaysia Fund (MAY): Similar to the Turkish fund above, Financials are the major holding in this fund. YTD the fund is up 43%. With this fund, investors can gain exposure to the some of the very conservative and strong Malaysian banks, rubber plantation companies and Genting, one of the top Malaysian companies with interests in casino operations among others. Currently the fund is trading at a 12% discount.

 4. Mexico Fund (MXF): The top three sectors in the fund are Telecom, Consumer Services and Basic Materials. Financials make up just 7% of the holdings. America Movil and Wal-Mart de Mexico are the top two holdings in the fund. YTD the share price has grown by 30% and the expense ratio is 1.70%.  The fund has an asset base of $395M. Despite the ongoing violence due to drug lords, Mexico remains an attractive market for investment. However the Mexican economy is heavily dependent on the U.S. economy.

5. Taiwan Fund (TWN):  This fund has $345 in assets and the expense ratio is 1.60%. Since Taiwan is heavily focused on hi-tech exports, technology accounts for more than one-fourth of the holdings. YTD the fund is up about 20% and the fund is now trading at a discount of 8%.

Constituents of the STOXX Americas Select Dividend 40 Index

The STOXX Americas Select Dividend 40 Index measures the performance of the highest dividend-paying stocks relative to their home markets.

This index is created based on the following conditions:

  • Stocks are screened by defined historical non-negative dividend-per-share growth rates and dividend to earnings-per-share ratios.
  • Index components are weighted by their indicated annual net dividend yield, i.e. the largest dividend-yielding companies have the highest weight in the index.
  • Fixed component numbers and cap factors guarantee index diversification.
  • All components have a dividend to earnings-per-share ratio of less than or equal to 60%.

The components of the STOXX Americas Select Dividend 40 Index are:

[TABLE=679]

Relative to the  S&P 500’s current yield of about 2%, all the U.S. stocks mentioned have higher yields. The only US banks in the list are New York Community Bancorp (NYB) and M&T Bank Corp (MTB). M&T recently agreed to buy Wilmington Trust(WL) for about $351 million. As per the deal, Wilmington Trust shareholders would receive about 0.05 shares of M&T stock for each share of Wilmington Trust and M&T would add $8.3 billion in deposits and $8.1 billion in loans. The majority of the U.S. constituents in the index come from the utility and telecom sectors which have traditionally paid out higher dividends. Cigarette makers Reynolds American (RAI), Altria Group (MO) and Lorillard (LO) have also consistently paid excellent dividends.

Among the Canadian stocks, except Royal Bank of Canada(RY) all other major banks are in the index. The tickers and dividend yields noted for IGM Financial, National Bank of Canada, Great-West Lifeco, Power Financial Corp and Power Corp. of Canada are based on their listing in the Toronto Exchange.

Top 10 European Companies by Market Cap

The table below lists the Top 10 European companies by market capitalization as of November 15, 2010:

[TABLE=678]

Source: FT Markets Data

The above list excludes firms from Eastern Europe and Russia and the market cap is based on the stock price on the domestic exchanges. Among the many European banking giants, only HSBC (HBC) of UK made it to this list with market cap of about $194 billion. In the pharmaceutical sector, it is interesting to note that Swiss drug companies Novartis (NVS) and  Roche (RHHBY) have market caps exceeding $125 billion. Nestle (NSRGY) owns many popular brands and has a strong presence in emerging countries.